How do I apply a custom window to rolling function #7641
Replies: 5 comments 60 replies
-
|
First of all, let's define some sample data that we can use to verify that the algorithm works without accessing your pile of netcdf files: In [2]: import xarray as xr
...: import numpy as np
...:
...: # I'll use the name `precipitation` here, but you can substitute that for `msc_prep`
...: precipitation = xr.Dataset(
...: {
...: "station_a": ("time", [6, 7, 8, 2, 1, 9, 8, 1, 7]),
...: "station_b": ("time", [2, 7, 5, 4, 9, 5, 3, 8, 1]),
...: "station_c": ("time", [7, 9, 1, 4, 6, 3, 8, 6, 7]),
...: "time": xr.date_range("2001-01-01", periods=9, freq="6H"),
...: }
...: ).to_array(dim="station", name="precipitation")
...: precipitation
Out[2]:
<xarray.DataArray 'precipitation' (station: 3, time: 9)>
array([[6, 7, 8, 2, 1, 9, 8, 1, 7],
[2, 7, 5, 4, 9, 5, 3, 8, 1],
[7, 9, 1, 4, 6, 3, 8, 6, 7]])
Coordinates:
* time (time) datetime64[ns] 2001-01-01 2001-01-01T06:00:00 ... 2001-01-03
* station (station) object 'station_a' 'station_b' 'station_c'As an aside, while you're iterating on the issue (or even later) I'd suggest extracting the data from your huge netcdf files into a single, smaller one (that way, you don't have to wait while the massive, unchunked files are being loaded and subset): # run once:
msc_prep = prsent_prep["PREC_ACC_NC"].isel(
south_north=xr.DataArray(station_indices[:, 0], dim="station"),
west_east=xr.DataArray(station_indices[:, 1], dim="station"),
).sel(Time=slice("2000", "2013"))
msc_prep.to_netcdf("msc_prep.nc")
# then load from the small file
msc_prep = xr.open_dataset("msc_prep.nc", engine="netcdf4").compute()Since this is a simpler version than the code we discussed during the office hours on Friday, I actually think we don't need the rolling operation. Instead, we can use a cumulative sum to construct labels for each consecutive rainfall event: In [6]: rainfall_events = precipitation >= 5
...: labels = (
...: np.logical_not(rainfall_events)
...: .cumsum(dim="time")
...: .where(rainfall_events)
...: .rename("rainfall_events")
...: )
...: labels
Out[6]:
<xarray.DataArray 'rainfall_events' (station: 3, time: 9)>
array([[ 0., 0., 0., nan, nan, 2., 2., nan, 3.],
[nan, 1., 1., nan, 2., 2., nan, 3., nan],
[ 0., 0., nan, nan, 2., nan, 3., 3., 3.]])
Coordinates:
* time (time) datetime64[ns] 2001-01-01 2001-01-01T06:00:00 ... 2001-01-03
* station (station) object 'station_a' 'station_b' 'station_c'We could create unique labels by prepending the station name, but that would mean we might have to do complex string operations to recreate the indexes. Instead, we'll use In [7]: import flox.xarray
...:
...: flox.xarray.xarray_reduce(precipitation.astype(float), "station", labels, func="sum")
Out[7]:
<xarray.DataArray 'precipitation' (station: 3, rainfall_events: 4)>
array([[21., nan, 17., 7.],
[nan, 12., 14., 8.],
[16., nan, 6., 21.]])
Coordinates:
* station (station) object 'station_a' 'station_b' 'station_c'
* rainfall_events (rainfall_events) float64 0.0 1.0 2.0 3.0In order to also get the time span for each group, I think we have to do multiple In [18]: _, time = xr.broadcast(precipitation, precipitation.time)
...:
...: start = flox.xarray.xarray_reduce(time, "station", labels, func="min")
...: end = flox.xarray.xarray_reduce(time, "station", labels, func="max")
...: xr.Dataset({"start": start, "end": end})
Out[18]:
<xarray.Dataset>
Dimensions: (station: 3, rainfall_events: 4)
Coordinates:
* station (station) object 'station_a' 'station_b' 'station_c'
* rainfall_events (rainfall_events) float64 0.0 1.0 2.0 3.0
Data variables:
start (station, rainfall_events) datetime64[ns] 2001-01-01 ......
end (station, rainfall_events) datetime64[ns] 2001-01-01T12:...(@dcherian, any idea on how to simplify that, and how to avoid the potentially very sparse result? Maybe constructing unique rainfall event labels, then creating a multi-index from that is the way?) cc @scottyhq For the more complex condition you had which also took the succeeding value into account we'd use |
Beta Was this translation helpful? Give feedback.
-
|
sorry for the late follow-up. Yes, we don't need the file anymore, now that reading the data should be much quicker. There's a few steps missing to create # don't compute `prsent_prep`, that's your entire dataset and most likely won't fit into memory all at once
prsent_prep = xr.open_mfdataset(fs, chunks={"Time": 1, "south_north": 508, "west_east": 680})["PREC_ACC_NC"]
# I think I remember you resampled the time series to every 6 (?) hours. If that's still what you want, do this before the `compute`
# (insert `.resample(Time="6H")` or similar)
msc_prep = (
prsent_prep.isel(
south_north=xr.DataArray(station_indices[:, 0], dims = "station_indices"),
west_east=xr.DataArray(station_indices[:, 1], dims = "station_indices"),
)
.sel(Time=slice("2000", "2013"))
.compute()
)
rainfall_events = msc_prep >= 5
event_labels = np.logical_not(rainfall_events).sum(dim="Time").where(rainfall_events).rename("rainfall_events")
_, time = xr.broadcast(msc_prep, msc_prep.Time)
rain = flox.xarray.xarray_reduce(msc_prep.astype(float), event_labels, func="sum").rename("rainfall_events")
start = flox.xarray.xarray_reduce(time, event_labels, func="min")
end = flox.xarray.xarray_reduce(time, event_labels, func="max")
result = xr.Dataset({"rain": rain, "start": start, "end": end}) |
Beta Was this translation helpful? Give feedback.
-
|
I have was looking at the result. I am not sure for the date output. It does not seem right. The first output, the start was 2001-02-09 but the end was 2002-06-04. That does not seem right. |
Beta Was this translation helpful? Give feedback.
-
|
I resample it before saving it. |


Beta Was this translation helpful? Give feedback.
-
|
so then it works, but not as intended. If that's possible, could you upload the resampled subset ( |
Beta Was this translation helpful? Give feedback.
-
|
Just send me a hi through email, so I have your email. Or if you put your email here I will send send you the access credential. Thanks |
Beta Was this translation helpful? Give feedback.
-
|
|

Beta Was this translation helpful? Give feedback.
-
|
I was looking at the results. I am not sure for the date output. It does not seem right. The first output, the start was 2002-02009 but the corresponding end date was 2002-06-04. That does not seem right. It seems not to be what I was expecting.
…________________________________
From: Justus Magin ***@***.***>
Sent: Monday, April 17, 2023 5:18 AM
To: pydata/xarray ***@***.***>
Cc: Houssou, Dela ***@***.***>; Author ***@***.***>
Subject: Re: [pydata/xarray] How do I apply a custom window to rolling function (Discussion #7641)
sorry for the late follow-up. Yes, we don't need the file anymore, now that reading the data should be much quicker. There's a few steps missing to create msc_prep, though:
# don't compute `prsent_prep`, that's your entire dataset and most likely won't fit into memory all at once
prsent_prep = xr.open_mfdataset(fs, chunks={"Time": 1, "south_north": 508, "west_east": 680})["PREC_ACC_NC"]
# I think I remember you resampled the time series to every 6 (?) hours. If that's still what you want, do this before the `compute`
# (insert `.resample(Time="6H")` or similar)
msc_prep = (
    prsent_prep.isel(
        south_north=xr.DataArray(station_indices[:, 0], dims = "station_indices"),
        west_east=xr.DataArray(station_indices[:, 1], dims = "station_indices"),
    )
    .sel(Time=slice("2000", "2013"))
    .compute()
)
rainfall_events = msc_prep >= 5
event_labels = np.logical_not(rainfall_events).sum(dim="Time").where(rainfall_events).rename("rainfall_events")
_, time = xr.broadcast(msc_prep, msc_prep.Time)
rain = flox.xarray.xarray_reduce(msc_prep.astype(float), event_labels, func="sum").rename("rainfall_events")
start = flox.xarray.xarray_reduce(time, event_labels, func="min")
end = flox.xarray.xarray_reduce(time, event_labels, func="max")
result = xr.Dataset({"rain": rain, "start": start, "end": end})
—
Reply to this email directly, view it on GitHub<#7641 (reply in thread)>, or unsubscribe<https://github.com/notifications/unsubscribe-auth/AYHHVQQZBOJGUO6XMZV7RWLXBUKG5ANCNFSM6AAAAAAV7EWWVI>.
You are receiving this because you authored the thread.Message ID: ***@***.***>
|
Beta Was this translation helpful? Give feedback.
-
|
@DOptimusPrime We have a favor to ask. We'd like to point to this discussion thread as an example of how to utilize xarray's high level computational patterns. Would you be able to post - as a new comment in this discussion because our link-checker chokes on the GitHub anchor if we try to point to a specific thread post as in the comment above - the "final" solution that you worked out? Thank you! |
Beta Was this translation helpful? Give feedback.
-
|
Yes. I can do that.
Get Outlook for iOS<https://aka.ms/o0ukef>
…________________________________
From: Jessica Scheick ***@***.***>
Sent: Wednesday, July 5, 2023 8:25:32 PM
To: pydata/xarray ***@***.***>
Cc: Houssou, Dela ***@***.***>; Mention ***@***.***>
Subject: Re: [pydata/xarray] How do I apply a custom window to rolling function (Discussion #7641)
@DOptimusPrime<https://github.com/DOptimusPrime> We have a favor to ask. We'd like to point to this discussion thread as an example of how to utilize xarray's high level computational patterns<xarray-contrib/xarray-tutorial#186>. Would you be able to post - as a new comment in this discussion because our link-checker chokes on the GitHub anchor if we try to point to a specific thread post as in the comment above<#7641 (reply in thread)> - the "final" solution that you worked out? Thank you!
—
Reply to this email directly, view it on GitHub<#7641 (comment)>, or unsubscribe<https://github.com/notifications/unsubscribe-auth/AYHHVQR7B26GD4TJPMMCDDTXOWWRZANCNFSM6AAAAAAV7EWWVI>.
You are receiving this because you were mentioned.Message ID: ***@***.***>
|
Beta Was this translation helpful? Give feedback.
Uh oh!
There was an error while loading. Please reload this page.
-
I am working on this project. I have netcdf4 files. I calculated the amount of precipitation I have over every 6H time period. Out of that I looked at every instance where I have subsequent period of time where the precipitation is greater than 5 mm, I add those up. Then if the summation of those at a certain time is greater than 50mm ,I would like to see that. My goal is to see where we may have potential flooding event in the data. Everything works fine except that some dates are repeated more than twice which tell me that my code is not doing the summation of the events greater than 5mm. Let me explain what which some numbers. Let's say the amount of precipitation I have is this list [2,3,5,7,0,6,3,5,7,9,8,0]


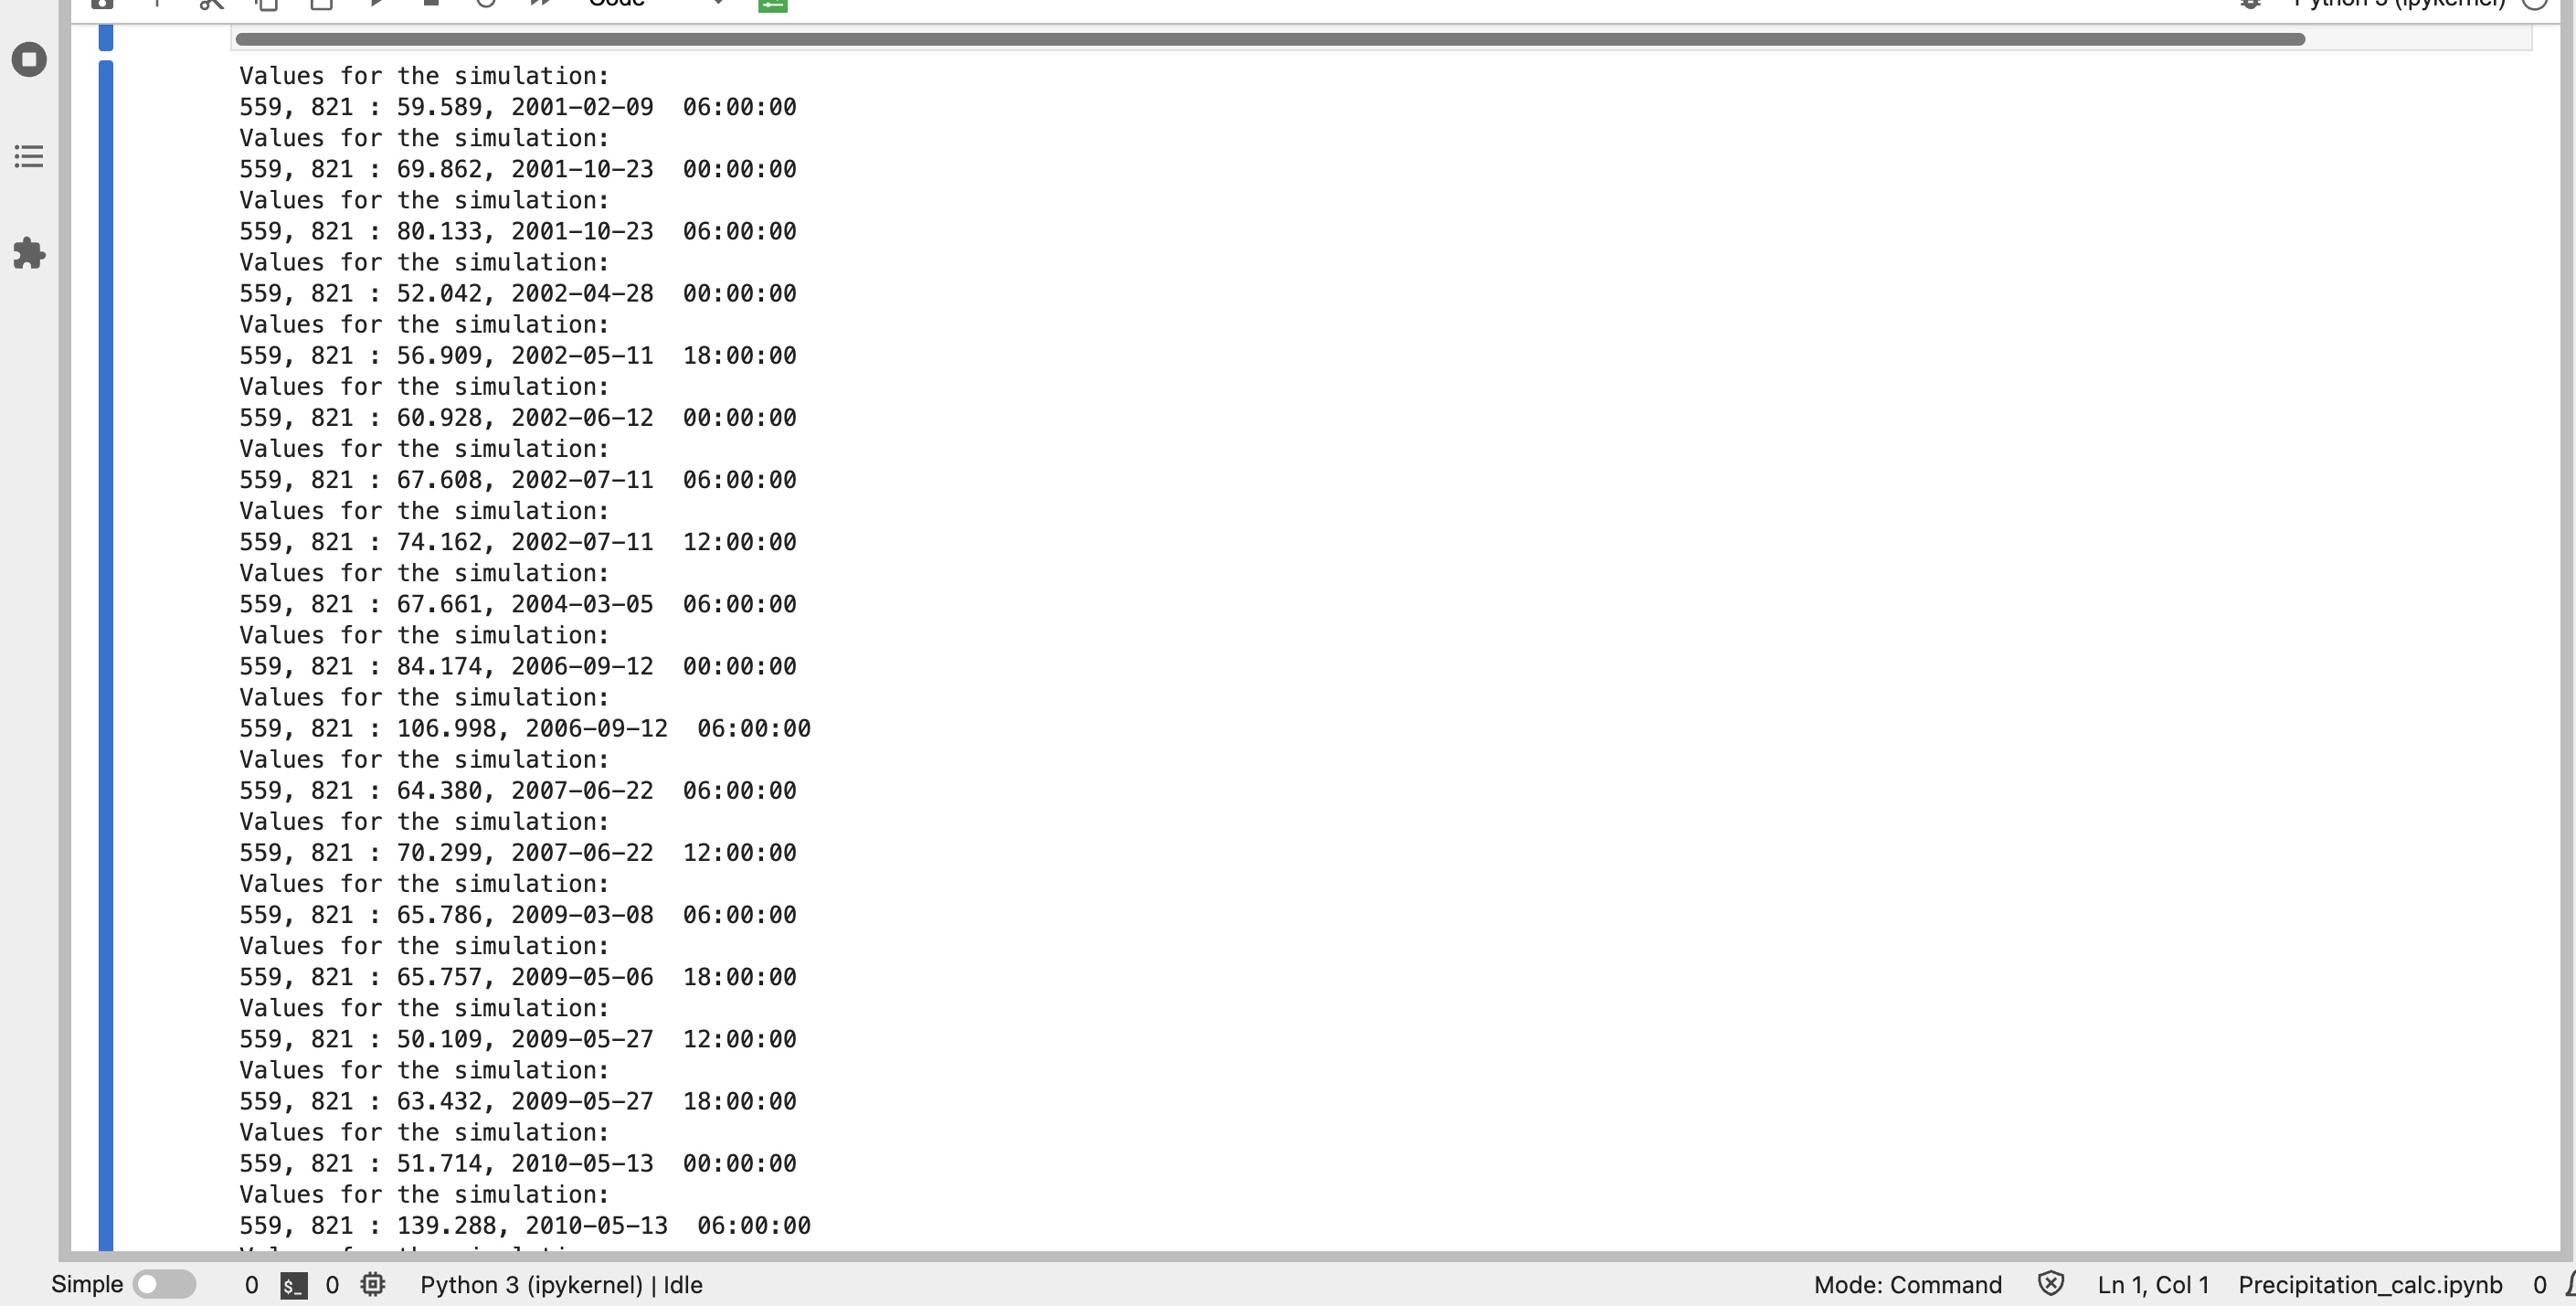
Then my summation of event 5mm will be:
5 + 7 = 12
6
5 + 7 + 9 + 8 = 29
This is an idea of what I am seeking to do so that in my output I return the summations greater than 50 mm. I have attached pictures of my code and the output
Beta Was this translation helpful? Give feedback.
All reactions