plot data on equal-area grid (Berkeley Earth) #7520
-
|
Berkeley Earth provides data on an equal-area grid. How can I plot that? For instance, import xarray as xr
import fsspec
url = 'https://berkeley-earth-temperature.s3.us-west-1.amazonaws.com/Global/Gridded/Complete_TAVG_Daily_EqualArea.nc'
with fsspec.open(url) as fobj:
ds = xr.open_dataset(fobj)
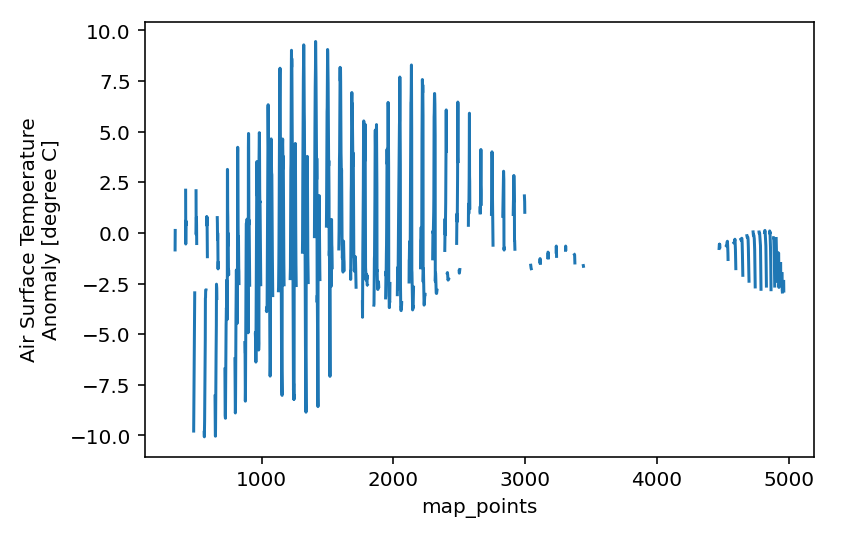
print(ds.temperature)reads daily temperature, which has time and map_points dimensions. How do I get a lat-on plot instead of this? Thanks! ds.temperature.isel(time=0).plot()
|
Beta Was this translation helpful? Give feedback.
Answered by
kmuehlbauer
Feb 10, 2023
Replies: 2 comments
-
|
Try to use scatter plot with x="longitude" and y=latitude. I'll look up the correct incantation, when I'm back at my machine and if no-one beats me to it. |
Beta Was this translation helpful? Give feedback.
0 replies
Answer selected by
mktippett
-
|
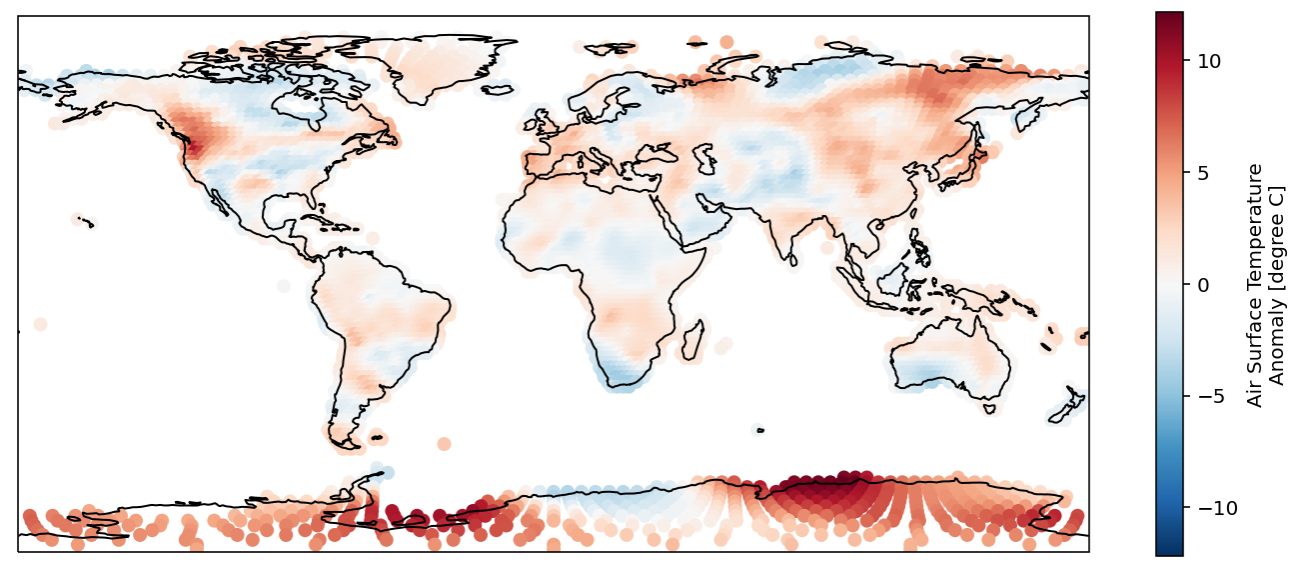
With details fig = plt.figure(figsize=(12, 5))
ax = plt.axes(projection=ccrs.PlateCarree())
xr.plot.scatter(ds.isel(time=-1), x='longitude', y='latitude', hue='temperature')
ax.coastlines()
plt.show()
data = ds["temperature"].isel(time=-1)
lats = ds["latitude"]
lons = ds["longitude"]

fig = plt.figure(figsize=(12, 5))
ax = plt.axes(projection=ccrs.PlateCarree())

plt.scatter(x=lons, y=lats, c=data, cmap='RdBu_r', vmin=-12, vmax=12)
ax.coastlines()

plt.colorbar()
plt.show() |
Beta Was this translation helpful? Give feedback.
0 replies
Sign up for free
to join this conversation on GitHub.
Already have an account?
Sign in to comment
Try to use scatter plot with x="longitude" and y=latitude. I'll look up the correct incantation, when I'm back at my machine and if no-one beats me to it.