Create Xarray dataset from grd files and list of grid coordinates #7443
-
|
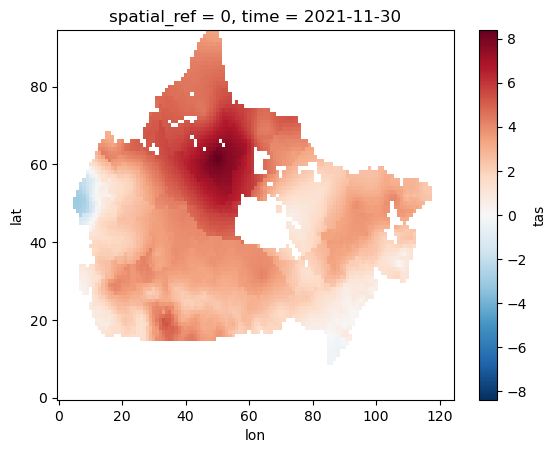
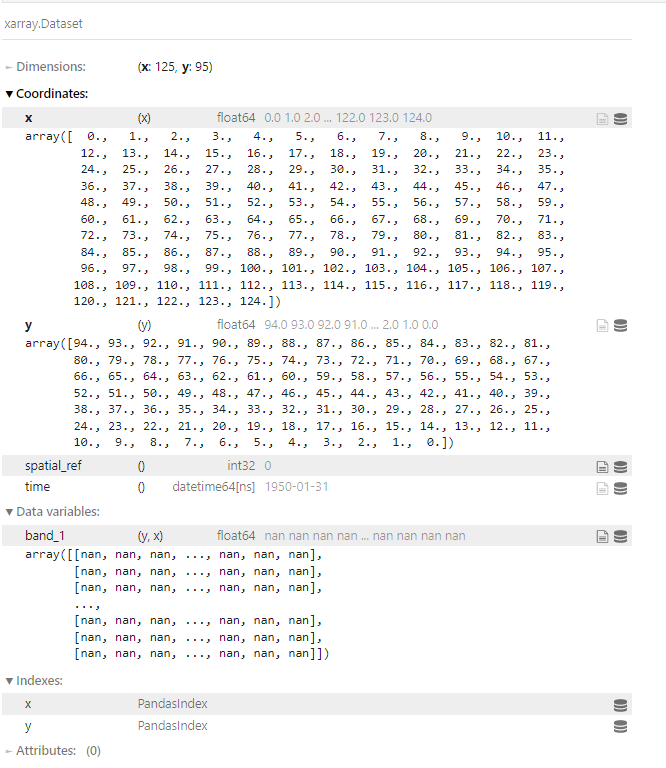
Hello, I have been looking at the documentation to find something covering this topic but I can't seem to find anything, my apologies if I have missed something. The data I am trying to use is of importance for Canadians climate data users so having a tutorial or some pointers on how to handle this would be amazing. I am trying to use a Canadian gridded historical dataset of temperature anomalies but it seems that I don't have the skills to pull that off. The grd file are temperatures anomalies on what I believe is a irregular grid. I have no experience with that kind of grid and I am having trouble building the xarray dataset. What I have (a subset of the grd and the text file is accessible here) : 2075 '.grd' files ('t190001.grd' to 't202112.grd' following "t{year}{month}.grd" structure) Naively, I thought the grid files were already georeferenced and all so I started by doing this : But as I plotted the results it became evident that my coordinates were only the indices of the pixels : So I believe I have to use the txt file provided, however, I have no idea how to make the xarray grid using the grid's coordinates and how to make that match with my array obtained by loading a grid via rioxarray. Here is a sample, the complete file is available above. What baffles me is that most of the 11874 lines of the dataframe resulting from the txt file seem to be unique, so how could I fit an array of dimensions 125 lon by 95 lat into it. Here is the view of one grid file loaded as xarray, Any help would be greatly appreciated! Thank you so much |
Beta Was this translation helpful? Give feedback.
Replies: 2 comments
-
|
The grid file contains stacked 2D coordinates, which I guess is due to the grid's original coordinate system not being aligned with the lat / lon axes. To read the coordinates into 2D coordinates you can use: df = pd.read_csv(r"CANGRD_points_LL.txt", sep=" ", header=None, names=["y", "x", "lat", "lon"])
grid = df.set_index(["y", "x"]).to_xarray().set_coords(["lat", "lon"])
raw = xr.concat([...], dim="time")
ds = xr.merge([raw, grid]).assign_coords(time=times).rename_vars(...) |
Beta Was this translation helpful? Give feedback.
-
|
Thank you for your answer! I actually realized that I could just use rio.write_crs() right after import and proceed with my usual workflow. Your solution works as well of course but I am not familiar with dataset having multidimensional coordinates, so I will need to read up on that a bit. Thanks! |
Beta Was this translation helpful? Give feedback.
Thank you for your answer!
I actually realized that I could just use rio.write_crs() right after import and proceed with my usual workflow. Your solution works as well of course but I am not familiar with dataset having multidimensional coordinates, so I will need to read up on that a bit.
Thanks!