plot a dataset coordinate only #6048
Unanswered
michaelaye
asked this question in
Q&A
Replies: 2 comments
-
|
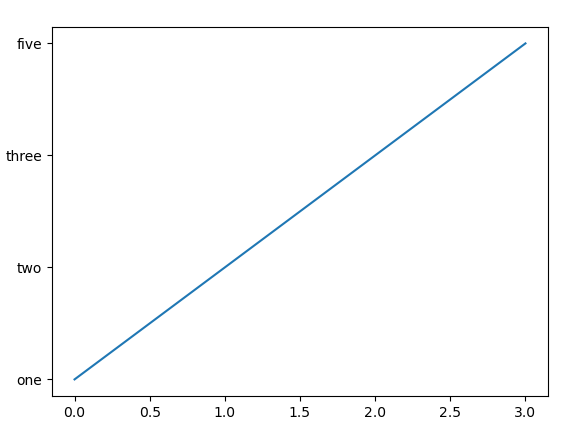
For hvplot errors https://github.com/holoviz/hvplot can probably help better, but just using ds = xr.tutorial.scatter_example_dataset()
plt.plot(ds.w)
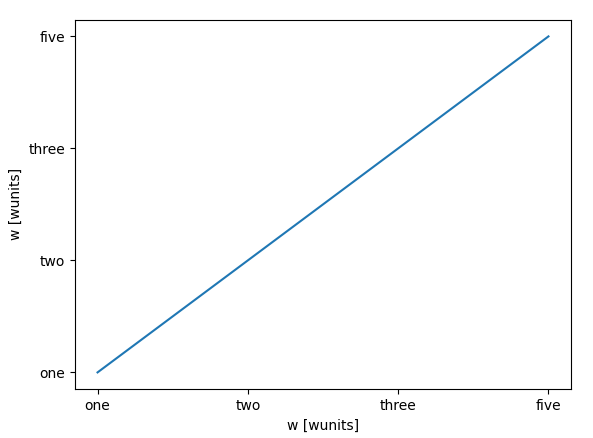
Using ds.w.plot()
|
Beta Was this translation helpful? Give feedback.
0 replies
-
|
Something like: |
Beta Was this translation helpful? Give feedback.
0 replies
Sign up for free
to join this conversation on GitHub.
Already have an account?
Sign in to comment
Uh oh!
There was an error while loading. Please reload this page.
-
For checking the distribution over a specific coordinate, it would be good to make it easy to plot any given coordinate over its index, like what happens when one does in MPL
plt.plot(arr)where the x-axis is automatically set as the index.I have this dataset:
and when I want to do the obvious (TM ;) ) of
ds.H.hvplot()I get:
What's the best practice to be able to quickly plot any given coordinate of a dataset?
Beta Was this translation helpful? Give feedback.
All reactions