How to do Spatial correlation analysis and significance value plotting as small dot over the same spatial plot #5982
Replies: 11 comments 10 replies
-
|
The above shown script , I have written for correlation analysis between two spatial datasets. Q2.> The above script produce two separate plots for r_value and p_value, but I am looking to produce single spatial plot having r_value as plt.pcolormesh plot and p_value<0.5 as small dot over it, wherever applicable !! Any help from the community !! Thanks in anticipation !! |
Beta Was this translation helpful? Give feedback.
-
|
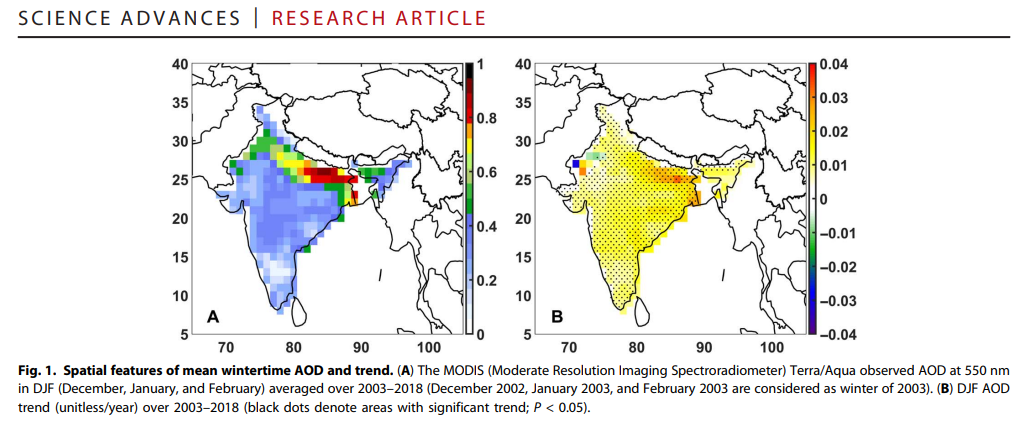
Example plot: (Note: This plot has been taken from a literature and has been produced using MATLAB, as mentioned there!)
|

Beta Was this translation helpful? Give feedback.
-
|
Maybe relevant correlations: One way is to first mask with ds.where(p_value < 0.05) and then plot scatter() and scale the size based off the value like this: Another way potential way: https://stackoverflow.com/questions/44250350/how-to-add-stippling-or-hatching-to-individual-polygons-in-a-basemap |
Beta Was this translation helpful? Give feedback.
-
|
** This doesn't include the p_value; just showing how to plot it. Use xskillscore if you want p-value.
|

Beta Was this translation helpful? Give feedback.
-
Didn't worked well, as expected. I just wanted to put a simple dot, where p_value<0.05 on trend plot, like: |
Beta Was this translation helpful? Give feedback.
-
|
As suggested above, I am using xskillscore to compute the Pearson correlation between two same dimension datasets as earlier |
Beta Was this translation helpful? Give feedback.
-
|
But I am getting Value Error: Any help on how to set dask_gufunc_kwargs allow_rechunk=True, in the above code. |
Beta Was this translation helpful? Give feedback.
-
|
Are you successful at this stage? |
Beta Was this translation helpful? Give feedback.
-
|
I tried to write something like that: But again I got an another type of error: |
Beta Was this translation helpful? Give feedback.
-
|
This error means that function |
Beta Was this translation helpful? Give feedback.
-
|
same answer here linking to xarray-contrib/xskillscore#357 |
Beta Was this translation helpful? Give feedback.
-
|
Thanks a lot, finally:.... |

Beta Was this translation helpful? Give feedback.
-
|
Still I am looking some robust way to include significance plot as dot mark (p<0.05), wherever applicable over spatial trend plot. Suggestion regarding hvplot.points, seems not compatible with the grouped sub-plots (e.g., 3row*3col=9 plots) . hvplot can be used with single plot. It also takes enough memory and time to render the single plot. |
Beta Was this translation helpful? Give feedback.
-
|
Hi there, were you able to find a more robust way of doing this? |
Beta Was this translation helpful? Give feedback.
-
|
Hi, I hope this helps. It is a lot of brute force, but it solved my problem. import matplotlib.pyplot as plt Correlationanomalies_chl ('time: 276,lat: 288,lon: 648)anomalies_sst ('time: 276,lat: 288,lon: 648)result_cor=[] for lat in range(0,len(chl_anomalies.lat)): result_cor=pd.DataFrame(result_cor, columns=('correlation', 'lat', 'lon')) pv_result_cor= pd.pivot_table(result_cor, index=result_cor.lat, columns=result_cor.lon,values='correlation') PLOTfig = plt.figure(figsize=(14,8),constrained_layout=True)
|

Beta Was this translation helpful? Give feedback.
-
|
Thank you so much for taking the time to post this. Would you mind telling me how you read the data in this code? especially this part: Correlation Is it a netcdf file, which was read with xarray? I really appreciate your help. |
Beta Was this translation helpful? Give feedback.
-
|
YOu are welcome. Yes, the data is netcdf read with xarray dataarray. |
Beta Was this translation helpful? Give feedback.
-
|
Thank you for your suggestion. I’ve implemented the code you provided, making several adjustments to accommodate my dataset. Despite these changes, I’ve encountered an error: TypeError: Dimensions of C (62, 360) should be one smaller than X(361) and Y(173) while using shading='flat'. This error message suggests referring to the help(pcolormesh) documentation. I would be extremely grateful if you could take the time to review my modified code. Your expertise would be invaluable in helping me identify any potential mistakes I might have made during the adaptation process: `import matplotlib.pyplot as plt Define the paths to the NetCDF filespath_ice = "/content/drive/My Drive/Data/extracted_sea_ice.nc" Loading data into xarray DataArraysds1 = xr.open_dataset(path_ice) Extract the data variablessic = ds1['SIC'] Calculate correlations and p-valuesresult_cor = [] for lat in range(len(ds1['LAT'])): Create DataFramesresult_cor_df = pd.DataFrame(result_cor, columns=('correlation', 'lat', 'lon')) Create a pivot table for correlationpv_result_cor = pd.pivot_table(result_cor_df, index=result_cor_df['lat'], columns=result_cor_df['lon'], values='correlation') Create the plotfig = plt.figure(figsize=(14, 8), constrained_layout=True) Show the plotplt.show() |
Beta Was this translation helpful? Give feedback.
-
|
Hvplot_obj * hvplot_obj2 should overlay
Then hvplot_overlay + hvplot_overlay lays out.
Check out holoviews layout (hvplot is method based holoviews)
…On Tue, Nov 23, 2021, 12:38 AM HARSHBARDHAN KUMAR ***@***.***> wrote:
Still I am looking some robust way to include significance plot as dot
mark (p<0.05), wherever applicable over spatial trend plot. Suggestion
regarding *hvplot.points*, seems not compatible with the grouped
sub-plots (e.g., 3row*3col=9 plots) . hvplot can be used with single plot.
It also takes enough memory and time to render the single plot.
—
You are receiving this because you commented.
Reply to this email directly, view it on GitHub
<#5982 (comment)>,
or unsubscribe
<https://github.com/notifications/unsubscribe-auth/ADU7FFTY2B7EJQKBDSR6FCLUNMZGVANCNFSM5H6KXA2Q>
.
|
Beta Was this translation helpful? Give feedback.
-
Beta Was this translation helpful? Give feedback.
-
|
Try to transpose your pv table (pv.T) or do
xx,yy=np.meshgrid(d1.LON,d1.LAT)
https://stackoverflow.com/questions/24791614/numpy-pcolormesh-typeerror-dimensions-of-c-are-incompatible-with-x-and-or-y
…On Thu, Sep 7, 2023, 22:44 Md. Ashif Imam Khan ***@***.***> wrote:
Thank you for your suggestion. I’ve implemented the code you provided,
making several adjustments to accommodate my dataset. Despite these
changes, I’ve encountered an error: TypeError: Dimensions of C (62, 360)
should be one smaller than X(361) and Y(173) while using shading='flat'.
This error message suggests referring to the help(pcolormesh) documentation.
I would be extremely grateful if you could take the time to review my
modified code. Your expertise would be invaluable in helping me identify
any potential mistakes I might have made during the adaptation process:
`import matplotlib.pyplot as plt
import numpy as np
import scipy as sp
import pandas as pd
import xarray as xr
import cartopy.crs as ccrs
import cartopy.feature as cfeature
from cartopy.mpl.ticker import LongitudeFormatter, LatitudeFormatter
Define the paths to the NetCDF files
path_ice = "/content/drive/My Drive/Data/extracted_sea_ice.nc"
path_carbon = "/content/drive/My Drive/Data/regrid_carbon.nc"
Loading data into xarray DataArrays
ds1 = xr.open_dataset(path_ice)
ds2 = xr.open_dataset(path_carbon)
Extract the data variables
sic = ds1['SIC']
spco2 = ds2['spco2']
Calculate correlations and p-values
result_cor = []
p_value = []
for lat in range(len(ds1['LAT'])):
for lon in range(len(ds1['LON'])):
try:
corr, p = sp.stats.pearsonr(sic[:, lat, lon], spco2[:, lat, lon])
except ValueError:
corr = np.nan
p = np.nan
result_cor.append((corr, float(ds1['LAT'][lat]), float(ds1['LON'][lon])))
p_value.append((p, float(ds1['LAT'][lat]), float(ds1['LON'][lon])))
Create DataFrames
result_cor_df = pd.DataFrame(result_cor, columns=('correlation', 'lat',
'lon'))
p_value_df = pd.DataFrame(p_value, columns=('p_value', 'lat', 'lon'))
Create a pivot table for correlation
pv_result_cor = pd.pivot_table(result_cor_df, index=result_cor_df['lat'],
columns=result_cor_df['lon'], values='correlation')
Create the plot
fig = plt.figure(figsize=(14, 8), constrained_layout=True)
ax = plt.axes(projection=ccrs.PlateCarree())
img = ax.pcolormesh(ds1['LON'], ds1['LAT'], pv_result_cor.values,
cmap='Wistia', shading='auto')
ax.set_xlabel('Longitude (°)')
ax.set_ylabel('Latitude (°)')
ax.add_feature(cfeature.LAND, facecolor='grey')
ax.coastlines()
ax.set_yticks([53, 54, 55, 56], crs=ccrs.PlateCarree())
ax.set_xticks([3, 6, 9], crs=ccrs.PlateCarree())
ax.set_yticklabels([53, 54, 55, 56])
ax.set_xticklabels([3, 6, 9])
fig.colorbar(img, ax=ax, shrink=0.99, pad=0.01, extend='neither',
label='Correlation')
Show the plot
plt.show()
`
—
Reply to this email directly, view it on GitHub
<#5982 (reply in thread)>,
or unsubscribe
<https://github.com/notifications/unsubscribe-auth/AVADOZVMQYD76E6KDOJOK2TXZIWZBANCNFSM5H6KXA2Q>
.
You are receiving this because you commented.Message ID:
***@***.***>
|
Beta Was this translation helpful? Give feedback.
Uh oh!
There was an error while loading. Please reload this page.
-
Beta Was this translation helpful? Give feedback.
All reactions