plot global variable with nans #5705
-
|
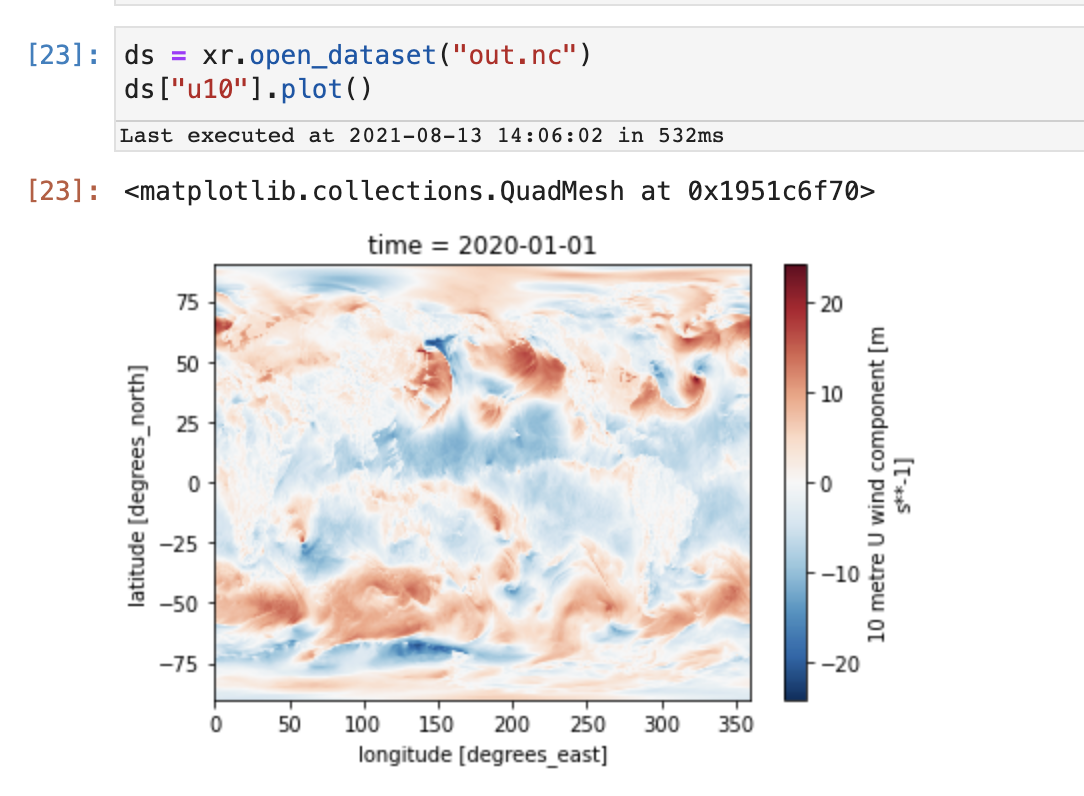
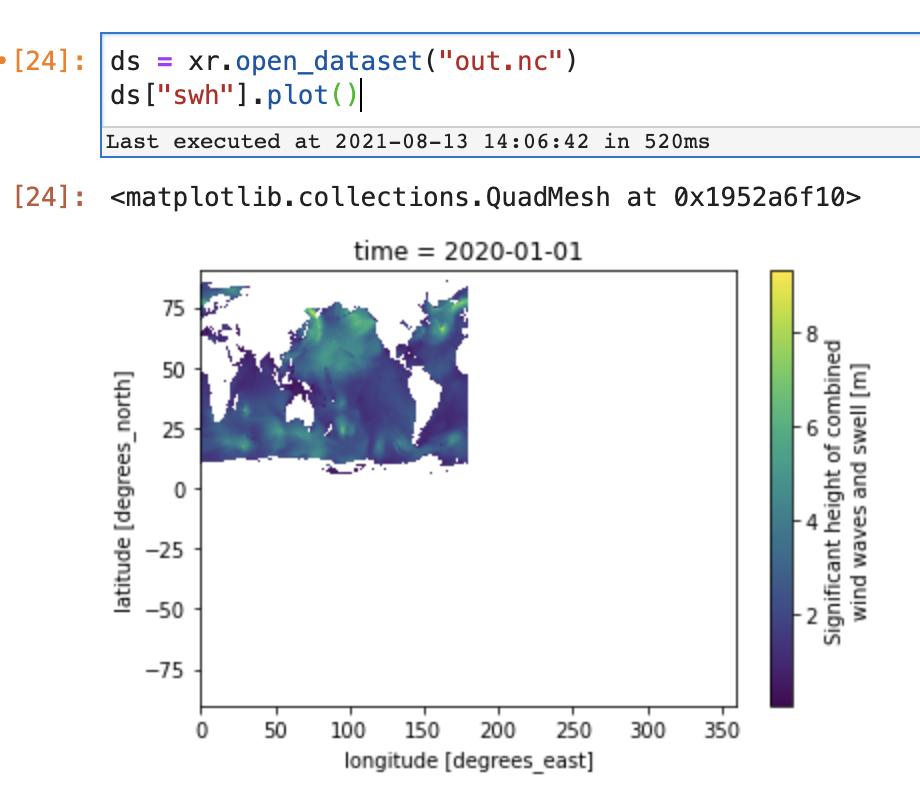
The default Here's is a file with u10 (u component of wind at 10 m) and swh (significant wave height)
AFAICT only difference is swh has NaNs Same behavior with pcolomesh
|

Beta Was this translation helpful? Give feedback.
Replies: 1 comment 2 replies
-
|
there seems to be something wrong with your data: ds.swh.where(ds.swh.notnull(), drop=True).plot()results in the expected plot, but the latitude and longitude coordinates cover only 0 to 180 degrees on the northern hemisphere (despite the plot covering the whole globe). Maybe there's something wrong with the processing steps producing this dataset? |
Beta Was this translation helpful? Give feedback.
-
|
thanks. I'll take a look. FYI source is similar to... |
Beta Was this translation helpful? Give feedback.
-
|
Think I got it. Wind and waves are at different resolution in ERA5 so think it does something funny when you request them together. |
Beta Was this translation helpful? Give feedback.
there seems to be something wrong with your data:
results in the expected plot, but the latitude and longitude coordinates cover only 0 to 180 degrees on the northern hemisphere (despite the plot covering the whole globe).
Maybe there's something wrong with the processing steps producing this dataset?