How to calculate least squares linear regression of vertical profile of so2 at each point (time, lat, lon) of the matrix? #5626
Replies: 2 comments 9 replies
-
|
Please see https://xarray.pydata.org/en/latest/generated/xarray.DataArray.polyfit.html |
Beta Was this translation helpful? Give feedback.
-
|
@dcherian , Thank you very much for your recommendations. I have read the documentation again, and managed to understand the parameters of Dataarray.polyfit (). so24d = so2_2003_2020.so2.sel(level = slice(500,1000)).polyfit(dim='level', deg=1)
so24d
<xarray.Dataset>
Dimensions: (degree: 2, latitude: 241, longitude: 480, time: 53)
Coordinates:
* degree (degree) int64 1 0
* time (time) datetime64[ns] 2003-01-01 ... 2020-02-01
* latitude (latitude) float64 90.0 89.25 88.5 ... -89.25 -90.0
* longitude (longitude) float64 0.0 0.75 1.5 ... 357.8 358.5 359.2
Data variables:
polyfit_coefficients (degree, time, latitude, longitude) float64 8.363e-...``` |
Beta Was this translation helpful? Give feedback.
-
|
@dcherian, thanks to your collaboration. I was able to get the results of the coefficients from
|
Beta Was this translation helpful? Give feedback.
-
|
update the code to be able to calculate import numpy as np
import pandas as pd
import xarray as xr
import matplotlib.pyplot as plt
import cartopy.crs as ccrs
with xr.open_dataset('sulphur_dioxideEne_dic2003_2020CMAS.nc') as ds:
print(ds.so2.attrs) # time slice
#so2_2003_2020 = ds.sel(time=slice('2003-01-01', '2020-12-01'))
#calculate and assign the height coordinate to the set.
so2_2003_2020 = ds.assign_coords(height =("level", (-7.9 * np.log(ds.level.sel(level=slice(500, 1000)).values /
ds.level[8].values))))
#Swap the level and height dimensions
so2_2003_2020 = so2_2003_2020.swap_dims({"level": "height"})
selected = so2_2003_2020.where(lambda x: x.time.dt.year == 2003, drop=True)
for t in range(len(ds.time)):
so24d = so2_2003_2020.so2.isel(time=t)
so24dC = so24d.copy()
#calculate so24d[z] / so24d[0]
for h in range(len(so24d.height)):
so24dC[h,:,:] = so24d.isel(height=h).values / so24d[8,:,:].values
#so24d = so24d.sel(height= slice(5.476,-0.0))
#so24d = so2_2003_2020.so2.sel(level = slice(500,1000)).polyfit(dim='level', deg=1)
#calculo de la regresion lineal de los perfil vertical de la altura con minimos cuadrados
#Hx = (so24dC.polyfit(dim='height', deg=1, full=True, cov=True)) # , skipna=False
Hx = -1 / so24dC.polyfit(dim='height', deg=1, full=True, cov=True) #, skipna=False
# plot SO2
fig = plt.figure(1, figsize=(15., 12.))
ax = plt.axes(projection=ccrs.PlateCarree(central_longitude=0.0))
ax.coastlines()
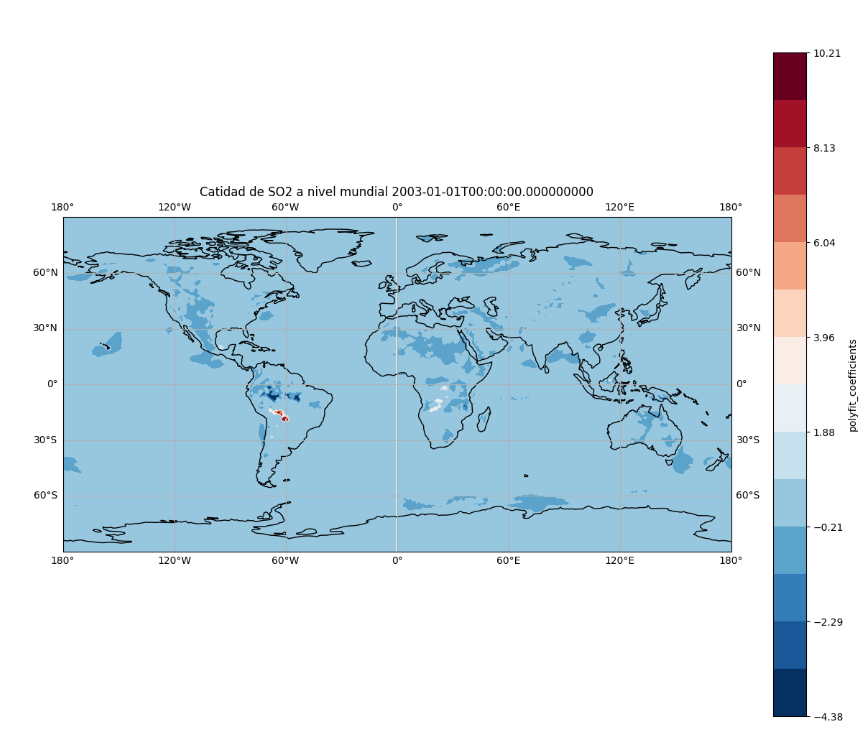
#Hx.polyfit_coefficients[0, :, :].plot.contourf(levels=(range(-5, 11,1))) # Hx.polyfit_coefficients[0,:,:].plot.contourf()
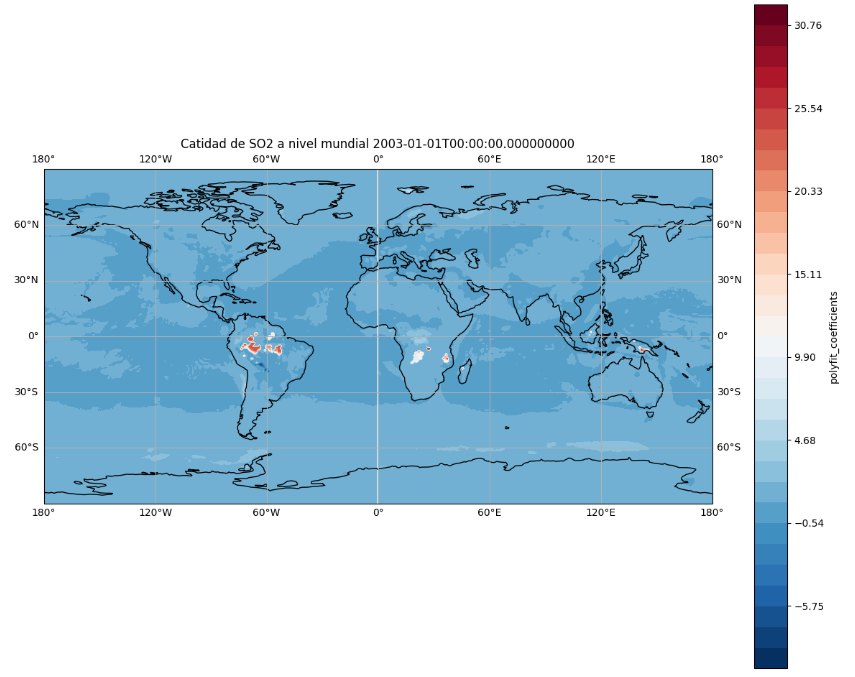
#Hx.polyfit_coefficients[1, :, :].plot.contourf(levels=(range(-10, 33, 1))) # Hx.polyfit_coefficients[1,:,:].plot.contourf()
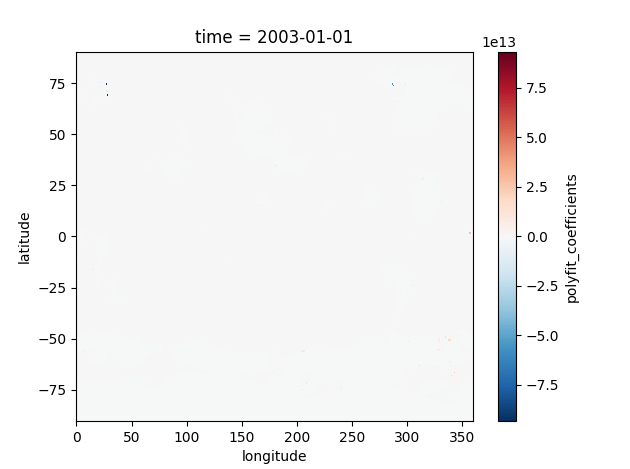
Hx.polyfit_coefficients[0, :, :].plot.contourf(levels=(np.linspace(-68000, 180009999999,num=1000))) # -1 / Hx.polyfit_coefficients[0,:,:].plot.contourf()
#Hx.polyfit_coefficients[1, :, :].plot.contour(levels=(range(-7, 35, 1))) # -1 / Hx.polyfit_coefficients[1,:,:].plot.contourf()
ax.gridlines(draw_labels=True)
#ax.legend()
plt.title("Catidad de SO2 a nivel mundial " + str(so24d.time.values))
plt.show()
|
Beta Was this translation helpful? Give feedback.
-
|
I think you should check your colorbar limits. |
Beta Was this translation helpful? Give feedback.
-
|
@dcherian , thanks
The values obtained in the order of 10e + 16 are the result of calculating:
<xarray.DataArray 'polyfit_coefficients' (degree: 2, latitude: 241, longitude: 480)>
print("min()\n", Hx.polyfit_coefficients[0, :, :].min().values) |
Beta Was this translation helpful? Give feedback.
-
|
@dcherian , I have reproduced the code in a general way. I would like to know if the code is correct? import copy
import numpy as np
import pandas as pd
import xarray as xr
import matplotlib as mpl
import matplotlib.pyplot as plt
from matplotlib.cm import get_cmap
import cartopy.crs as ccrs
so2 = (10 ** -10) * np.random.randn(241, 480, 9, 2)
latitude = np.linspace(-90, 90, 241)
longitude = np.linspace(0, 359.2, 480)
level = [500, 600, 700, 800, 850, 900, 925, 950, 1000]
time = pd.date_range("2003-01-01", periods=2)
reference_time = pd.Timestamp("2003-01-01")
ds = xr.Dataset(
data_vars=dict(
so2=(["latitude", "longitude", 'level', "time"], so2),
),
coords=dict(
longitude=(["longitude"], longitude),
latitude=(["latitude"], latitude),
level=(["level"], level),
time=time,
# reference_time=reference_time,
),
attrs=dict(
description="Weather related data.",
units='kg kg**-1',
long_name='Sulphur dioxide',
standard_name='mass_fraction_of_sulfur_dioxide_in_air'),
)
so2_2003_2020 = ds.assign_coords(height=("level", [np.percentile(ds.so2[0, 0, :, :].values, 87),
np.percentile(ds.so2[0, 1, :, :].values, 87),
np.percentile(ds.so2[0, 2, :, :].values, 87),
np.percentile(ds.so2[0, 3, :, :].values, 87),
np.percentile(ds.so2[0, 4, :, :].values, 87),
np.percentile(ds.so2[0, 5, :, :].values, 87),
np.percentile(ds.so2[0, 6, :, :].values, 87),
np.percentile(ds.so2[0, 7, :, :].values, 87),
np.percentile(ds.so2[0, 8, :, :].values, 87)]))
### Swap the level and height dimensions
so2_2003_2020 = so2_2003_2020.swap_dims({"level": "height"})
for t in range(len(ds.time)):
so24d = so2_2003_2020.so2.isel(time=t)
so24dC = so24d.copy()
# calculate so24d[z] / so24d[0] normalización
for h in range(len(so24d.height)):
so24dC[:, :, h] = so24d.isel(height=h).values / so24d[:, :, 8].values
# coefficients of the best fit for the resolution of the polynomial.
Hx = so24dC.polyfit(dim='height', deg=1, full=True, cov=True)
cmap = copy.copy(mpl.cm.get_cmap("jet"))
cmap.set_over(color='indigo')
cmap.set_under(color='w')
### plot SO2
fig = plt.figure(1, figsize=(15., 12.))
ax = plt.axes(projection=ccrs.PlateCarree(central_longitude=0.0))
ax.coastlines()
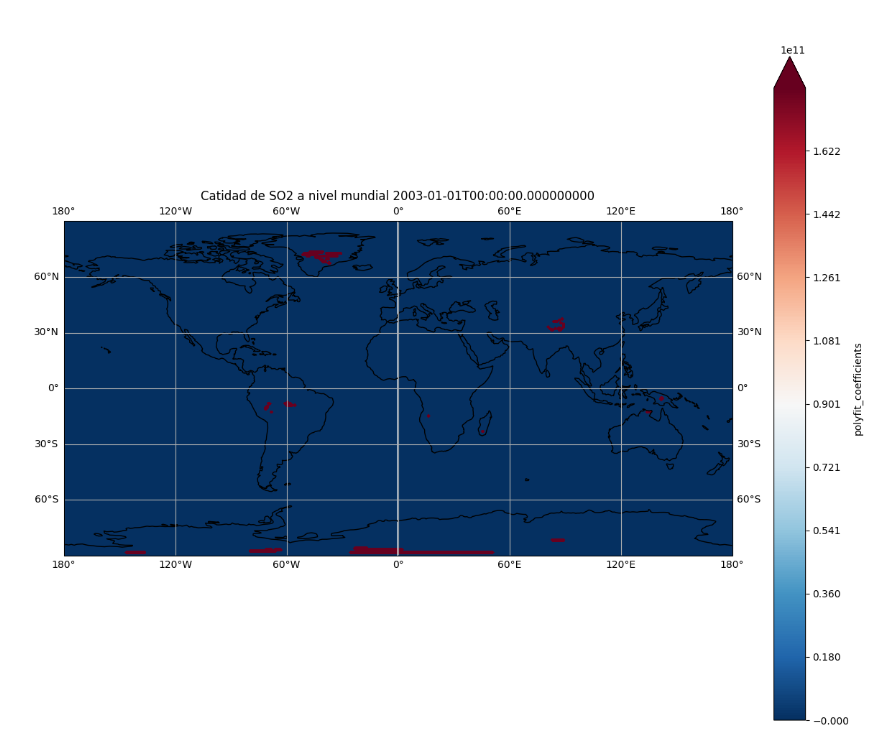
Hx.polyfit_coefficients[1, :, :].plot.contourf(
cbar_kwargs={'label': 'kg kg ** - 1 Sulfur dioxide mass_fraction_of_sulfur_dioxide_in_air'},
levels=(np.linspace(0.5, Hx.polyfit_coefficients[1, :, :].max().values,
num=10)), cmap=cmap, vmin=0.5,
vmax=Hx.polyfit_coefficients[1, :, :].max().values)
ax.gridlines(draw_labels=True)
plt.title("Better fit coefficients SO2 " + str(so24d.time.values))
plt.show()``` |
Beta Was this translation helpful? Give feedback.
Uh oh!
There was an error while loading. Please reload this page.
Uh oh!
There was an error while loading. Please reload this page.
-
I would like to obtain the slope of the linear least squares regression of the vertical profile of so2 at each point (
time,lat,lon) of the array usingDataarry.polyfit (z [:], so2.level [:], 1)I would like to know how I can optimize the code. The code work is slow and I cannot get a least squares linear regression matrix with the polyfit method
dahx [t, lon, lat] .values = kr [0]Traceback (most recent call last):
File "/home/leo/.local/lib/python3.8/site-packages/IPython/core/interactiveshell.py", line 3441, in run_code
exec(code_obj, self.user_global_ns, self.user_ns)
File "", line 1, in
runfile('/home/leo/Documentos/Universidad/Trabajo_de_investigación/PerfilesVerticalesContaminantesAtmosfera/Datos/Plotting_CAMS_SO2.py', wdir='/home/leo/Documentos/Universidad/Trabajo_de_investigación/PerfilesVerticalesContaminantesAtmosfera/Datos')
File "/snap/pycharm-professional/248/plugins/python/helpers/pydev/_pydev_bundle/pydev_umd.py", line 197, in runfile
pydev_imports.execfile(filename, global_vars, local_vars) # execute the script
File "/snap/pycharm-professional/248/plugins/python/helpers/pydev/_pydev_imps/_pydev_execfile.py", line 18, in execfile
exec(compile(contents+"\n", file, 'exec'), glob, loc)
File "/home/leo/Documentos/Universidad/Trabajo_de_investigación/PerfilesVerticalesContaminantesAtmosfera/Datos/Plotting_CAMS_SO2.py", line 31, in
dahx[t,lon,lat].values = kr[0] # Obtener la pendiente (primer elemento)
File "/home/leo/.local/lib/python3.8/site-packages/xarray/core/common.py", line 257, in setattr
object.setattr(self, name, value)
File "/home/leo/.local/lib/python3.8/site-packages/xarray/core/dataarray.py", line 632, in values
self.variable.values = value
File "/home/leo/.local/lib/python3.8/site-packages/xarray/core/variable.py", line 516, in values
self.data = values
File "/home/leo/.local/lib/python3.8/site-packages/xarray/core/variable.py", line 367, in data
raise ValueError(
ValueError: replacement data must match the Variable's shape. replacement data has shape (); Variable has shape (241, 480)
Beta Was this translation helpful? Give feedback.
All reactions