Volume chart #36
Replies: 1 comment 8 replies
-
|
As the chart shows, the volume "V" is zero, so please check your data, is it set properly? |
Beta Was this translation helpful? Give feedback.
-
|
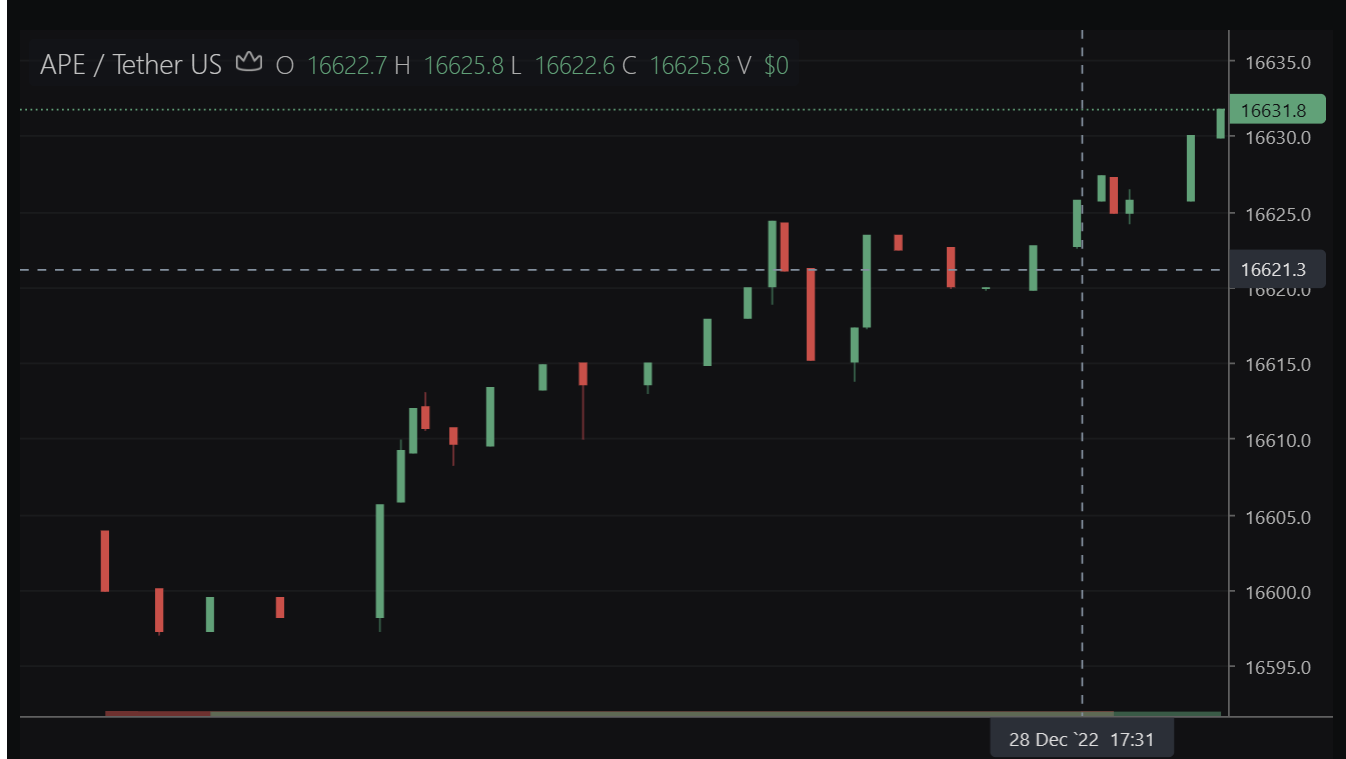
I paste your data in my package, and it displays fine. Here is my data.json file. If you want to make your candles more compact, you can add |
Beta Was this translation helpful? Give feedback.
-
|
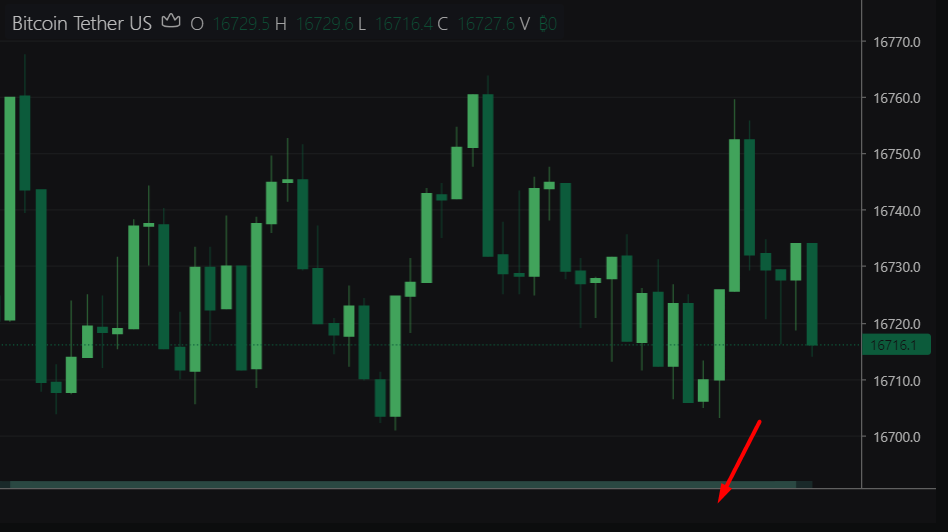
thank you. Index based true is what i was missing. Do you have any idea why the bootbar is missing? |
Beta Was this translation helpful? Give feedback.
-
|
@Klemencina it's in place, just no labels (coz index-based mode) |
Beta Was this translation helpful? Give feedback.
-
|
Is there any way to add labels @C451 |
Beta Was this translation helpful? Give feedback.
-
|
By fixing the code. Not promising it very soon. You need to round these for example [1672247930676, 16605.9, 16610.0, 16605.9, 16609.2, 0],
[1672247943412, 16609.1, 16612.0, 16609.1, 16612.0, 0],
[1672247958423, 16612.1, 16613.2, 16610.6, 16610.7, 0],
[1672247989118, 16610.7, 16610.7, 16608.3, 16609.7, 0],
[1672248028610, 16609.6, 16613.4, 16609.6, 16613.4, 0], |
Beta Was this translation helpful? Give feedback.
Uh oh!
There was an error while loading. Please reload this page.
Uh oh!
There was an error while loading. Please reload this page.
-
I'm trying to display volume candles(every x volume a new candle starts). When alot of volume comes threw multiple candles can be created in seconds. While sometimes it takes a few minutes to create a candle. When i add the candle data the chart looks like this.
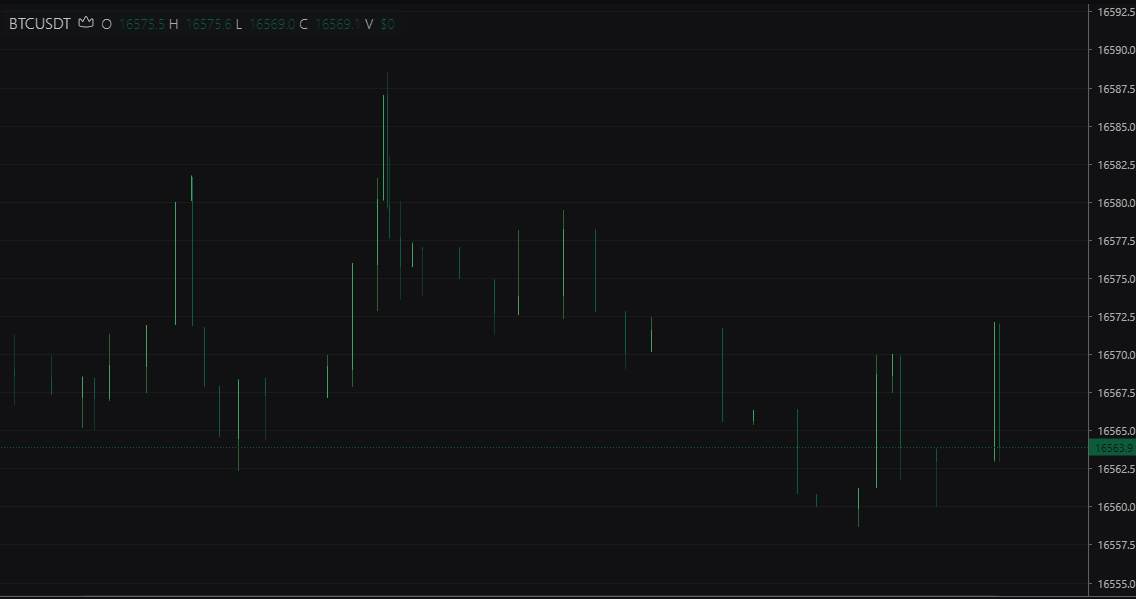
Is there a way to fix this?
Edit
The data:
[1672276087829, 16560.8, 16560.8, 16560.0, 16560.0, 0],
[1672276173154, 16559.9, 16561.2, 16558.7, 16561.2, 0],
[1672276210262, 16561.3, 16570.0, 16561.3, 16568.7, 0],
[1672276241300, 16568.6, 16570.0, 16567.5, 16570.0, 0],
[1672276257256, 16569.9, 16570.0, 16561.8, 16563.9, 0],
[1672276330174, 16563.8, 16563.9, 16560.0, 16563.0, 0],
[1672276448840, 16563.1, 16572.1, 16563.0, 16572.1, 0],
[1672276457317, 16572.0, 16572.1, 16563.0, 16563.9, 0]
Beta Was this translation helpful? Give feedback.
All reactions