Replies: 1 comment 1 reply
-
|
Hey @ziomill , Can you open a bug for this issue? Please include more information about the two traces/spans (in particular, the name of the instrumentation that produced them). If possible, could you create a repro scenario that'd allow to debug this? |
Beta Was this translation helpful? Give feedback.
1 reply
-
|
@mateuszrzeszutek I opened the bug Thank you for your support |
Beta Was this translation helpful? Give feedback.
Sign up for free
to join this conversation on GitHub.
Already have an account?
Sign in to comment
Uh oh!
There was an error while loading. Please reload this page.
-
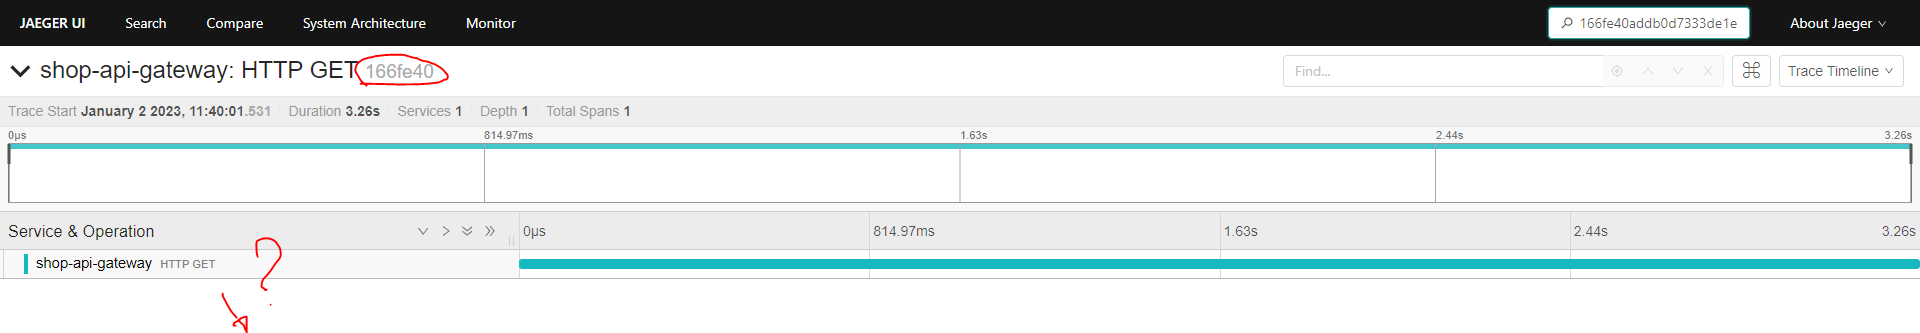
Hi guys,
I'm using Open Telemetry auto instrumentation (1.21.0) on a Spring Cloud Gateway instance for trace handling. The Spring Cloud Gateway simply proxies incoming calls to some internal microservices.
It happens that, for a single incoming request, two different traces are created at the gateway level.
See this log:
So, in the jaeger console, I see two traces for this single incoming request.
The orphaned one:
And the correct one:
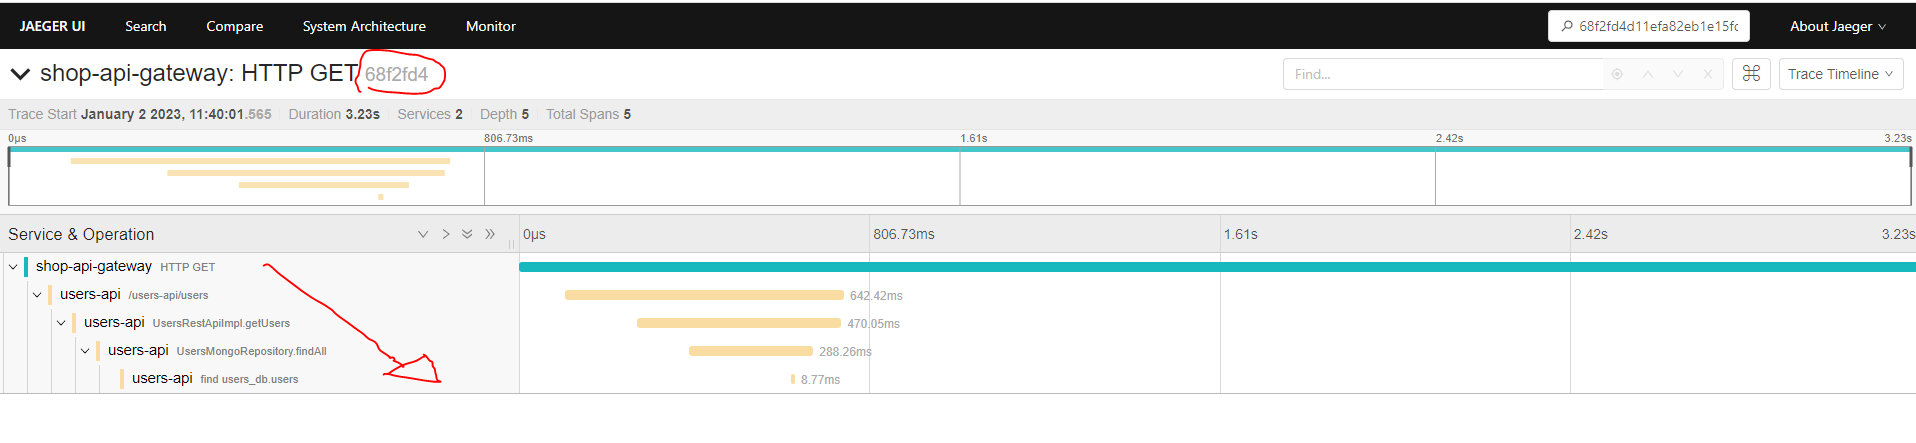
It sounds like a bug in the netty auto instrumentation to me.
Do you agree with me?
Thank you for help!
Beta Was this translation helpful? Give feedback.
All reactions