Opentelemetry Jaeger Exporter sends only few traces to Jager #6256
-
|
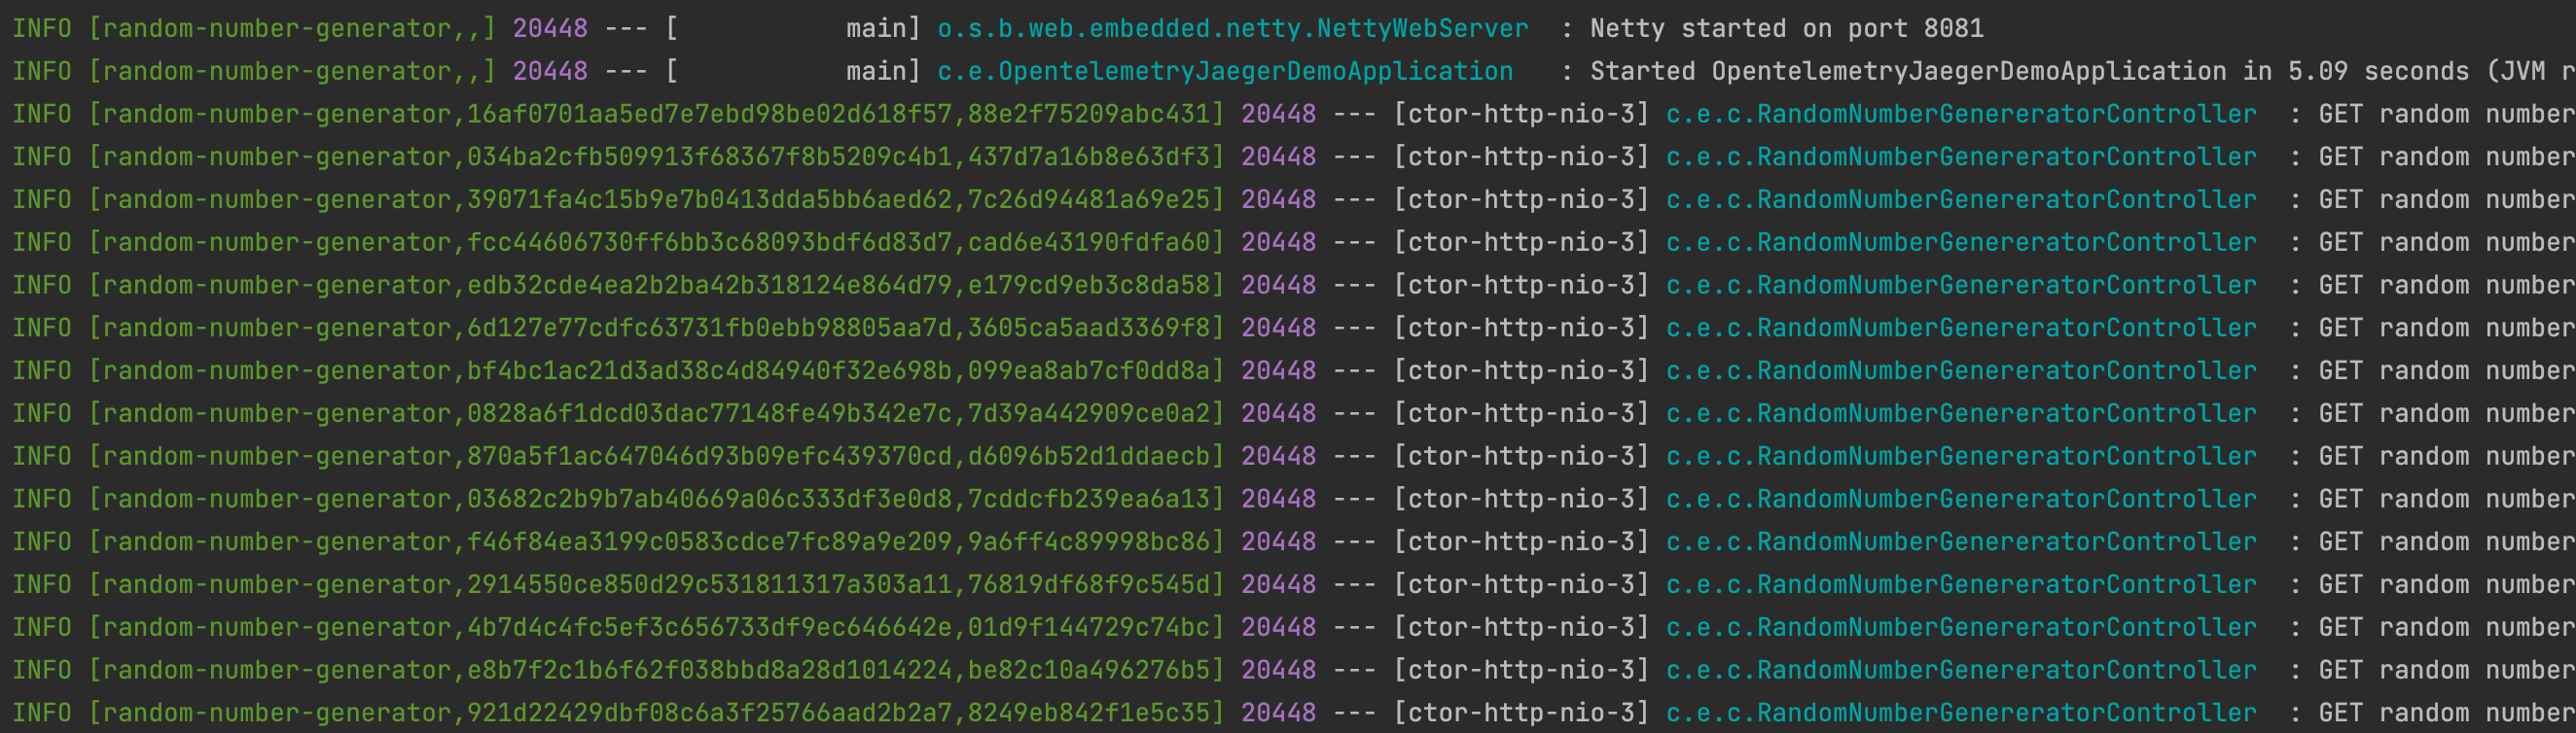
Hi, I was testing this After I had run this application locally I tried to call the endpoint (with Postman). The application was run together with the All-in-One executable Jaeger service (by means of docker, see official documentation). I called the endpoint of my demo application more the 10 times in around 5 seconds:
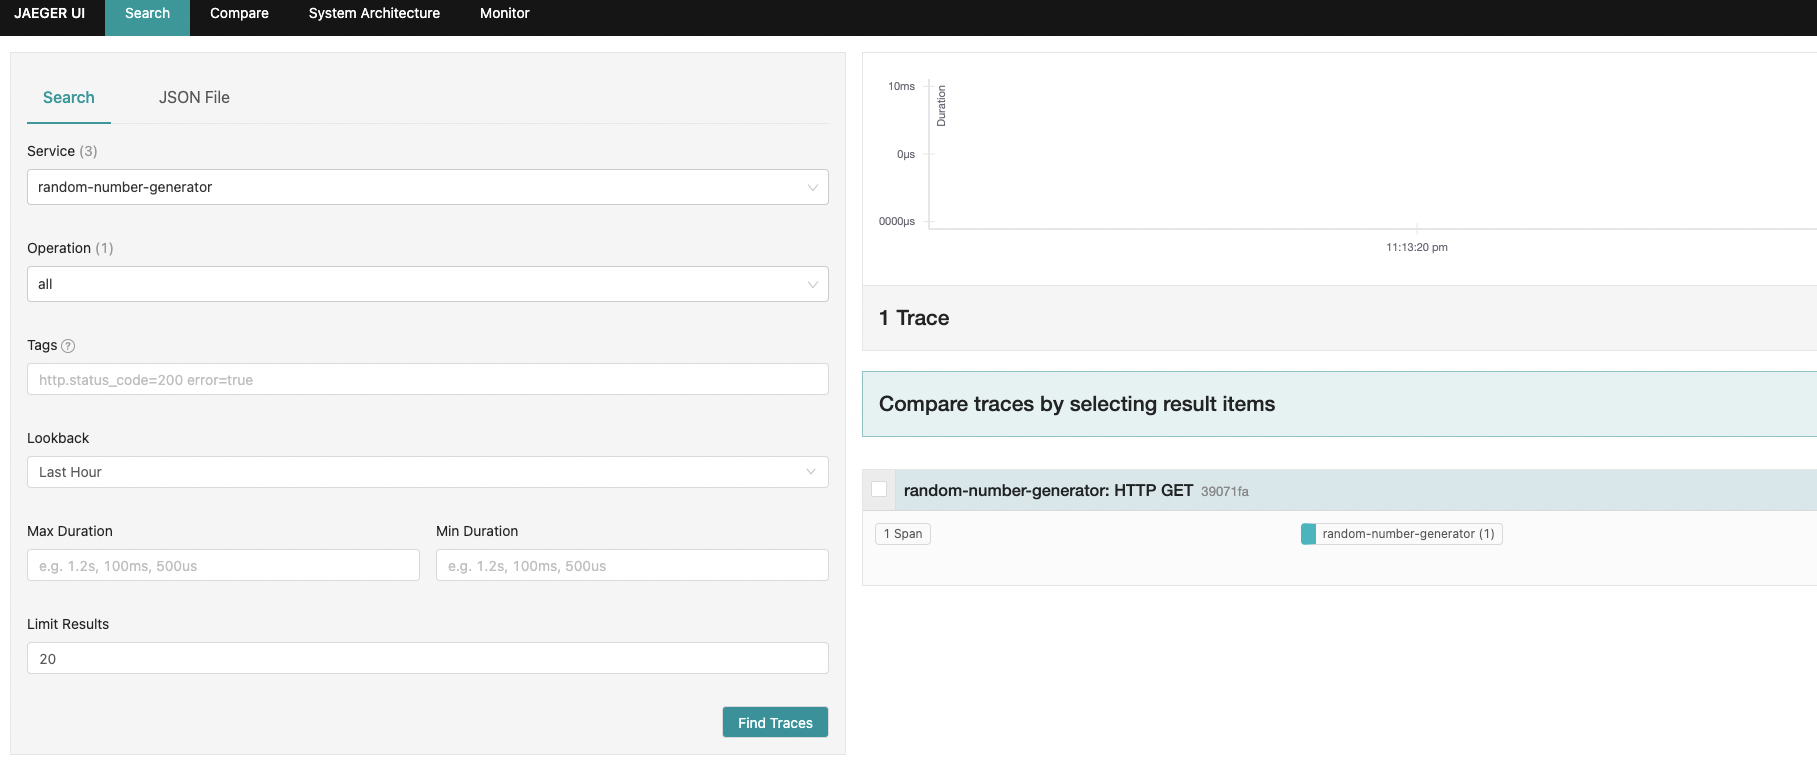
However from the Jaeger UI only one call was traced (the third one):
It looks like some calls are randomly traced (actually only a few of them). Is there anyone know if it's a configuration problem or something else? Thanks! |
Beta Was this translation helpful? Give feedback.
Replies: 2 comments 5 replies
-
|
Hey @SimoneGiusso , |
Beta Was this translation helpful? Give feedback.
-
|
Hi @mateuszrzeszutek thanks for your reply. Actually I'm simply running the app through my IDE (intelliJIDEA as I'm doing just some tests now) so it's not running in a docker container and I'm not passing any specific env vars and I'm not using a sampler. All is running locally (Jaeger container + Demo APP) on my M1 Air mac. When solved this problem I'll have other tests to do. |
Beta Was this translation helpful? Give feedback.
-
|
Oh, I noticed that you're using Spring Cloud Sleuth; I was under the impression that you might be using the javaagent, thus my question about configuration; nevermind that then. Try using the |
Beta Was this translation helpful? Give feedback.
-
|
Hi. I added I can clearly see in the console that |
Beta Was this translation helpful? Give feedback.
-
|
Hmm, that means that something is not exactly right with the application itself/the default Spring Sleuth configuration; we've excluded the possibility of jaeger or jaeger exporter losing things. Can you create an issue about this in the Spring Sleuth repo? There doesn't seem to be anything broken with OpenTelemetry itself, at the first glance. |
Beta Was this translation helpful? Give feedback.
-
|
Thank a lot for your support. I raised an issue in the spring-cloud-sleuth-otel repo. |
Beta Was this translation helpful? Give feedback.
-
|
Hi. Thanks @mateuszrzeszutek for your support. The problem was solved: a spring sleuth otel configuration was needed to sample all the traces: |
Beta Was this translation helpful? Give feedback.
Hi. Thanks @mateuszrzeszutek for your support. The problem was solved: a spring sleuth otel configuration was needed to sample all the traces:
spring.sleuth.otel.config.trace-id-ratio-based=1.0