You signed in with another tab or window. Reload to refresh your session.You signed out in another tab or window. Reload to refresh your session.You switched accounts on another tab or window. Reload to refresh your session.Dismiss alert
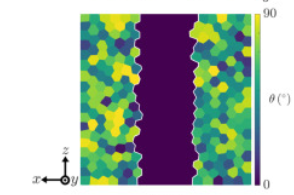
the ' θ' is the angle between each grain’s ’c‘ axis and the sample’s Z axis, the 'ψ' determines the amount of misorientation spread within the region characterized via the half width at half maximum of the distributions. How can I get these data and visualize it through neper to get something similar to the following figure?
I noticed that neper has a new function to output ODF, but I made an error using the following instructions. How can I implement it?
neper -S 4.sim -resmesh odf

error; Failed to find orispace.
reacted with thumbs up emoji reacted with thumbs down emoji reacted with laugh emoji reacted with hooray emoji reacted with confused emoji reacted with heart emoji reacted with rocket emoji reacted with eyes emoji
Uh oh!
There was an error while loading. Please reload this page.
Uh oh!
There was an error while loading. Please reload this page.
-
the ' θ' is the angle between each grain’s ’c‘ axis and the sample’s Z axis, the 'ψ' determines the amount of misorientation spread within the region characterized via the half width at half maximum of the distributions. How can I get these data and visualize it through neper to get something similar to the following figure?
I noticed that neper has a new function to output ODF, but I made an error using the following instructions. How can I implement it?
Beta Was this translation helpful? Give feedback.
All reactions