-
|
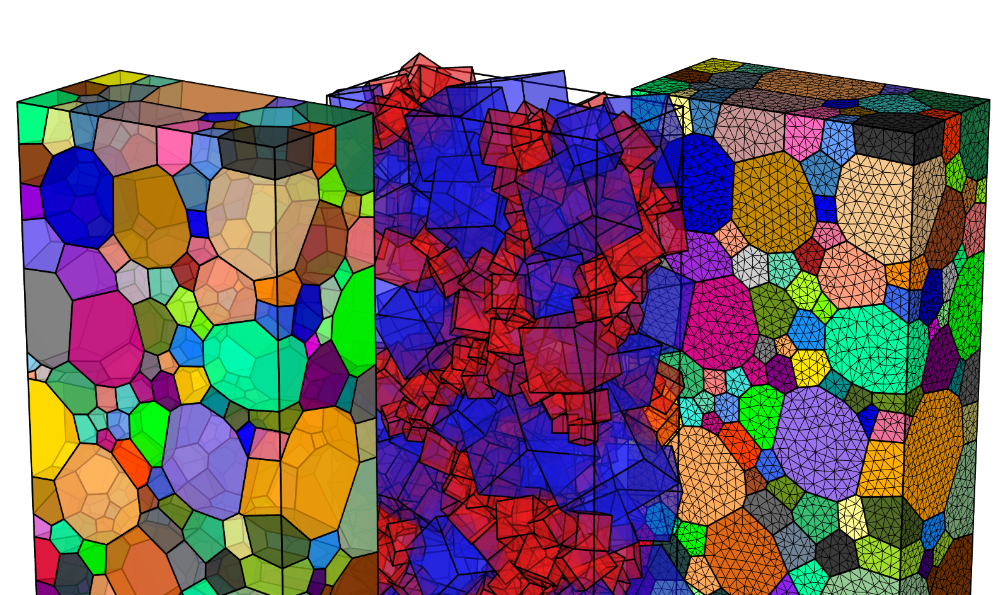
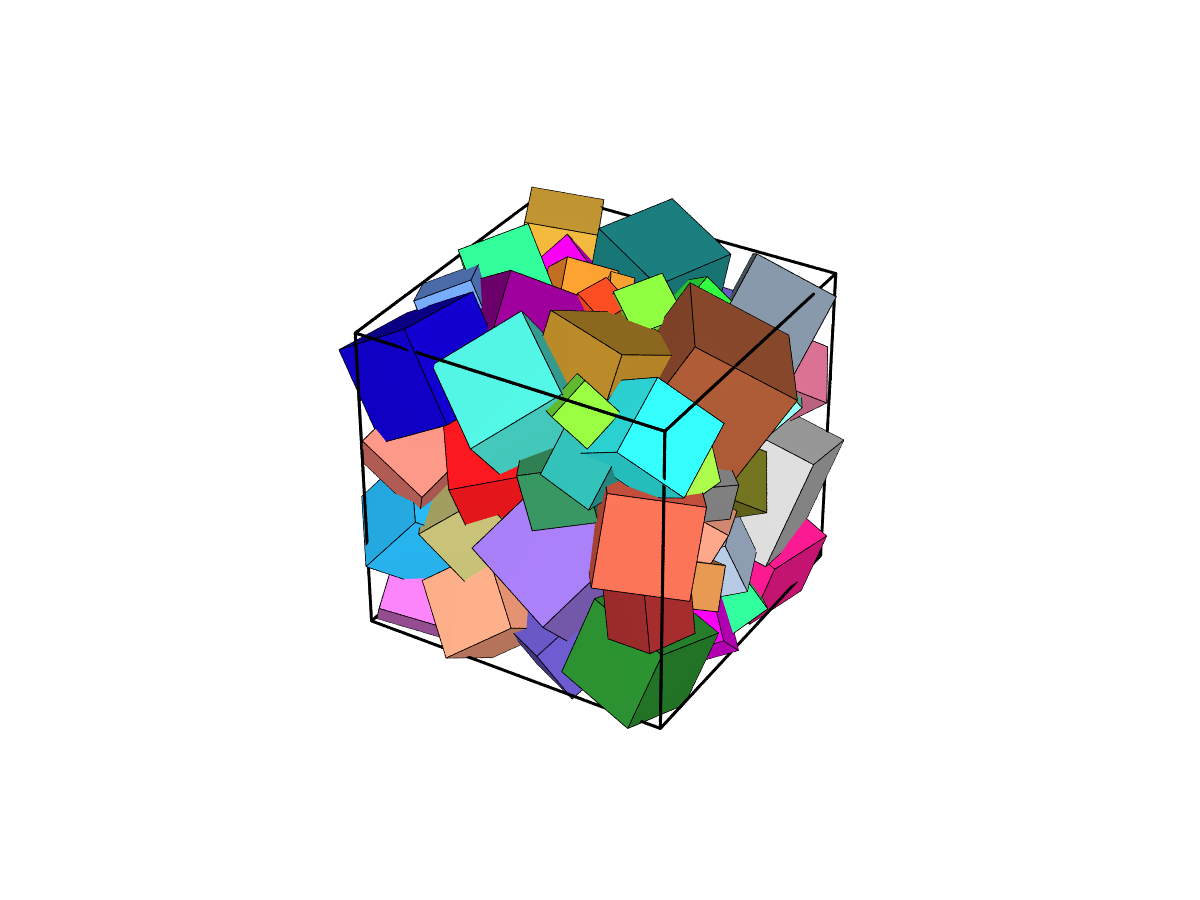
Hello, How do you produce the plot in the middle (the one showing cubes with different orientations)?
Thank you, |
Beta Was this translation helpful? Give feedback.
Answered by
rquey
Mar 3, 2022
Replies: 1 comment
-
|
You can use Example:
See also https://neper.info/tutorials/visualize_tessellation.html. |
Beta Was this translation helpful? Give feedback.
0 replies
Answer selected by
rquey
Sign up for free
to join this conversation on GitHub.
Already have an account?
Sign in to comment
You can use
-showcrystal,-datacrystal, etc.Example:
See also https://neper.info/tutorials/visualize_tessellation.html.