Skip to content

Visualising crystal orientations #316

Answered by rquey
FelixTheTBone asked this question in Q&A
Discussion options

You must be logged in to vote

Here is an example:

neper -T -n 10 -morpho gg -statcell x,y,z,radeq -for tess,ori -orides rotmat
awk '{print $1,$2,$3}' n10-id1.stcell > cellcenters
awk '{print $4}' n10-id1.stcell > cellrads

paste cellrads n10-id1.ori | awk '{print 0.4*$1,$2,$3,$4,$5,$6,$7,$8,$9,$10}' > cubes

neper -V n10-id1.tess,cellcenters               \
          -showpoint 0                          \
          -dataedgerad 0.0012                   \
          -print tess                           \
          -showpoint 1                          \
          -showcell none                        \
          -showedge "domtype==1"                \
          -datapointrad "cube:file(cubes)"      \
          -datapo…

Replies: 2 comments 1 reply
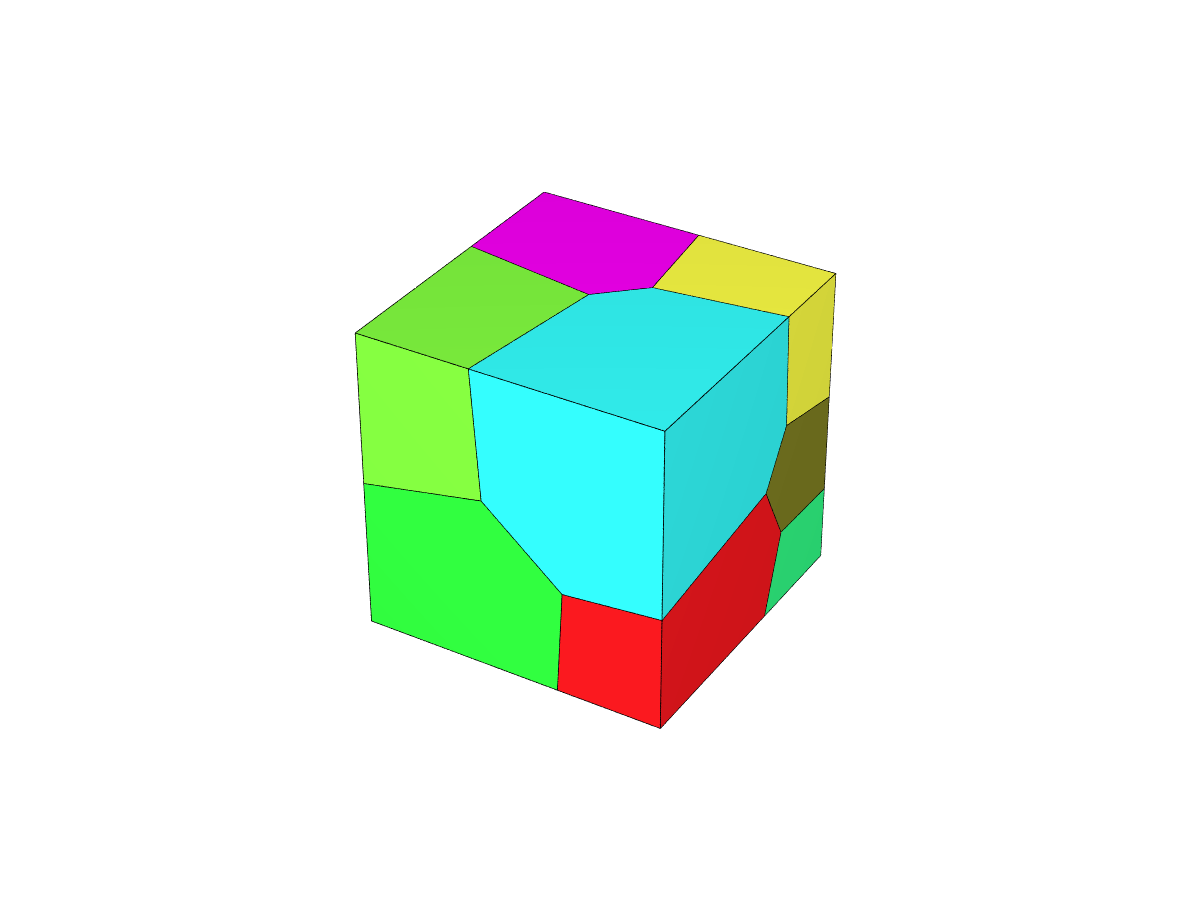
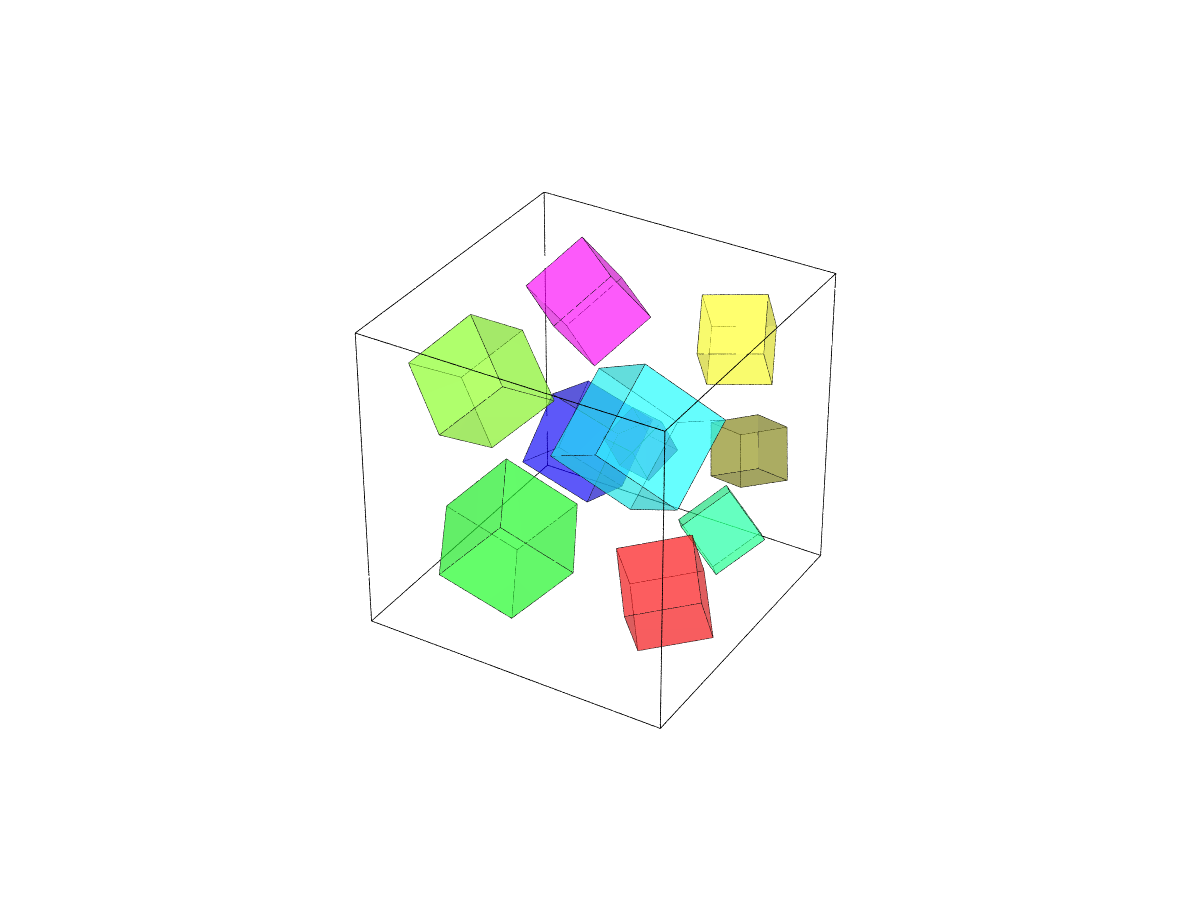
Comment options

You must be logged in to vote
1 reply
@FelixTheTBone
Comment options

Answer selected by rquey
Comment options

You must be logged in to vote
0 replies
Sign up for free to join this conversation on GitHub. Already have an account? Sign in to comment
Category
Q&A
Labels
None yet
3 participants