Replies: 3 comments 9 replies
-
|
Thanks for opening this up @erthward. Would you be able to share a small snippet that creates a similar DataArray as the one you have, possibly using data from the Planetary Computer? I think there's a couple avenues to explore:
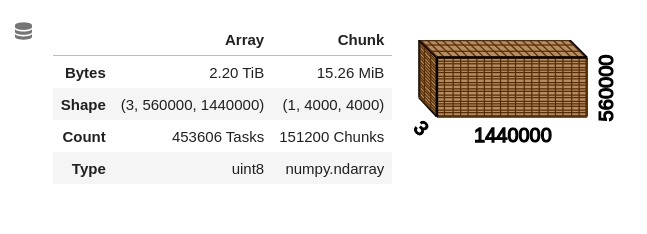
shape = (3, 560000, 1440000)
chunks = (1, 4000, 4000)

a = xr.DataArray(da.ones(shape, chunks=chunks, dtype="uint8"), dims=("band", "y", "x"))
subset = a.isel(x=slice(10), y=slice(10))

dask.visualize(subset, optimize_graph=True)
If you're able to share a reproducible example I'll be able to take a closer look. |

Beta Was this translation helpful? Give feedback.
-
|
Hey, Tom. This is extremely helpful! Thank you! I do not know where or how I missed the important detail about instantiating the client (I even read through the dask scheduling page a couple times but had been confused how to make sure that my job was using the distributed scheduler on the hub), but that seems to have been precisely the problem. Here's the block of cluster-creating code I had been using: # get gateway
gateway = dask_gateway.Gateway()
# set cluster options
options = gateway.cluster_options()
options['worker_cores'] = worker_cores
options['worker_memory'] = worker_memory
# create cluster
cluster = gateway.new_cluster()
# autoscale the cluster, or else just set at max_workers
if autoscale_cluster:
cluster.adapt(minimum=min_workers, maximum=max_workers)
else:
cluster.scale(max_workers)As soon as I added Thanks again! And I'm sorry for the totally rookie mistake! Drew |
Beta Was this translation helpful? Give feedback.
-
|
Glad we got that sorted out; you aren't the first to run into this issue. I made a small change to our Dask quickstart to highlight the need for creating the client. |
Beta Was this translation helpful? Give feedback.
-
|
Excellent, thanks! This was actually a really subtle problem, and I'm still not sure I see what's going on here, which kinda bugs me from the perspective of wanting to understand exactly what's happening under the hood. Is it that, by default, dask would use the local node to create the DAG, submit it to the scheduler, process it, and then start sending the scheduled tasks out to all the workers, but that once we instantiate the cluster Client object then the default changes to running some or all of those steps on one of the worker nodes? Anyway, psyched to be moving forward! Thanks again for your support on this! |
Beta Was this translation helpful? Give feedback.
-
That's always the case, regardless of whether you have a distributed All operations using Dask build up a task graph. The graph construction / result is identical whether or not you have a local or distributed scheduler. When asked to compute a result (with By default this is the threaded local scheduler. When you create a Client, it (by default) registers itself as the active scheduler in the Dask config system, as show below: In [1]: import dask, dask.distributed
In [2]: dask.config.get("scheduler", None)
In [3]: client = dask.distributed.Client()
In [4]: dask.config.get("scheduler", None)
Out[4]: 'dask.distributed'
In [5]: dask.distributed.get_client()
Out[5]: <Client: 'tcp://127.0.0.1:37993' processes=4 threads=8, memory=15.42 GiB> |

Beta Was this translation helpful? Give feedback.
-
|
Ah! Okay, thanks! I knew the DAG and scheduling always had to happen, but I think it wasn't clear to me what was being done where. I think the key insights for me are:
Thanks again,Tom! Enormously helpful! |
Beta Was this translation helpful? Give feedback.
-
|
Sorry, one last thing I should have mentioned: I also tried running the code outside the notebook, two ways:
|
Beta Was this translation helpful? Give feedback.
-
|
Hi, Tom.
(CAVEAT: sorry for all the screenshots instead of code blocks! GitHub kept
rejecting the screenshot images I tried to add to my reply, don't know why,
but those seemed more important than formatted code blocks so I'm replying
by email. If code blocks are helpful then let me know and I'll create a
separate reply and format them there.)
Thanks again for being so responsive and helpful on here! I'm continuing to
dig into this, so I'll report back if/when other useful info comes up, but
here's a quick reply to your two first thoughts:
1. Appears correctly pruned, in that it matches your output (below).
However, quick thought: I'm actually not sure what you mean by 'pruned',
and a search for "dask pruning" doesn't turn up much. Do you mean you want
to check that each task is receiving an equal-size and non-overlapping
slice of the data structure?
[image: image.png]
2. That is the maximum number of tasks produced by anything I've tried so
far (in that I naively ran the computation for the whole globe) but the
kernel instantly crashes even when the task graph is much smaller (e.g., I
tried using 10K and even 20K chunk sizes, which reduce the number tasks in
that same final array to ~86K, in the 20K chunksize case; I also tried
running the previous spatial subsets that I mentioned, and those have on
the order of <= 10^5 tasks).
I'm happy to share an example, but would need to spin up a usefully
comparable example that doesn't publicize analysis code yet. Meanwhile, I
did manage to create a similar failure using PC catalog data (and I'll note
beforehand that if anything I would have expected this to fail on the tail
end when it tried to load ~50 GB of data into the 32 GB VM, but instead of
doing that the job never registered a task graph ("*Scheduler is empty*")
in the dask dashboard and showed only a single worker (which I apologize, I
believe I quickly misread previously as no workers) and that worker didn't
appear to be doing much (despite the ProgessBar instance strangely
suggesting that the task was nearly halfway done) and then the kernel died
and threw the following screenshotted popup. This happened using an
autoscaling cluster with a max of 400 8 GB, single-core workers:
[image: image.png]
[image: image.png]
[image: image.png]
[image: image.png]
What seems stranger to me, however, is that if I use that same dataset but
spatially subset the output down to a result that is similar in size (~3.x
GB) to the output I was trying to plot with my own data then the task
succeeds quickly (17.1 s) but still never launches more than a single
worker (despite the output DataArray having 79K tasks) and never displays a
task graph. Is this expected behavior? Or is it possible that I'm doing
something that is preventing the cluster from spawning workers and
distributing the compute? Or is it possible that the dask dashboard is
wrong and workers actually are being used?
[image: image.png]
[image: image.png]
Finally, I then used my own data to create a roughly analogous subset and
try to plot that, and I get the following:
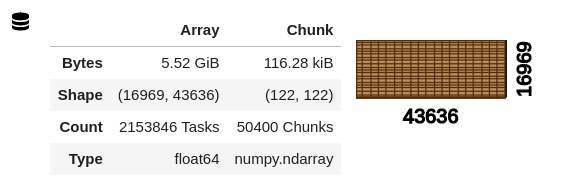
- fairly similar data structure (but ~3.5x fewer tasks)[image: image.png]
- task again never registers more than 1 worker, never displays a task
graph, then quickly dies
- identical behavior when I call `cluster.scale(400)` to try to force >1
worker
What I am now curious about too is what is going on with the cluster that
I've created. Is it possible that the scheduler is getting overloaded and
killing the jupyter kernel and then keeps leaving the clusters still
running? Even after this last pass died I was able to reload and sit and
watch the dask dashboard for a bit while workers keep slowly being added;
got up to 201 slowly, then suddenly jumped to >400, bumping around about
420-ish, which doesn't make sense given I thought 400 was the upper
limit...). Any clarity here would be great! And I would close the cluster,
but I'm not sure how to access and close it once my python process has died.
Not sure where this all puts me, and sorry for the information overload!
And my apologies for what are probably many dumb questions! I'm new to dask
and AKS distributed computing (much more used to SLURM on a campus
cluster), and I have little formal CS background, so I'm learning a lot
fast. I'll continue messing around and reading more. Meanwhile, curious to
hear what you think.
Thanks again!
…On Thu, Aug 18, 2022 at 10:28 AM Tom Augspurger ***@***.***> wrote:
Thanks for opening this up @erthward <https://github.com/erthward>. Would
you be able to share a small snippet that creates a similar DataArray as
the one you have, possibly using data from the Planetary Computer?
I think there's a couple avenues to explore:
1. Ensure that computations on the small spatial subset are correctly
pruned. A simple example on dummy data confirms this is correct, but we
should verify it with your data too:
shape = (3, 560000, 1440000)chunks = (1, 4000, 4000)
a = xr.DataArray(da.ones(shape, chunks=chunks, dtype="uint8"), dims=("band", "y", "x"))subset = a.isel(x=slice(10), y=slice(10))
dask.visualize(subset, optimize_graph=True)
[image: download]
<https://user-images.githubusercontent.com/1312546/185419472-ab244d63-06ec-4cc7-af25-ea494ecf9aef.png>
1. See if you can somehow minimize the number of tasks in the task
graph. Your second image shows a DataArray with 2,153,846 tasks. Dask does
have some per-task overhead and working with large task graphs can cause
slowness (especially between .compute() and computation starting) and
sometimes instability on the scheduler.
If you're able to share a reproducible example I'll be able to take a
closer look.
—
Reply to this email directly, view it on GitHub
<#94 (comment)>,
or unsubscribe
<https://github.com/notifications/unsubscribe-auth/ABOSTJR6CAHAGBQHJSLDMU3VZZCAFANCNFSM56XG2XWQ>
.
You are receiving this because you were mentioned.Message ID:
***@***.***
com>
|
Beta Was this translation helpful? Give feedback.
Uh oh!
There was an error while loading. Please reload this page.
-
Hi, All!
I am new to MSPC, and I am currently exploring it as an option for running an analysis for a project. I just recently got one of the project's datasets set up in COGs on Azure westeurope storage and indexed with a STAC. I have confirmed that I am able to use the MSPC Hub and the data's STAC to load the data into a lazy dask xr.DataArray (using
stackstac.stack) and then stream a very small spatial subset of it (using theDataArray.sel(x=slice(...), y=slice(...))method) into a numpy array and/or plot. However, I have run into problems as soon as I began trying to scale the work (even after spending some time doing my best to rationally optimize the COG blocksize and compression method and the DataArray dtype and chunksize arg).FYI: the dataset is a global mosaic of contemporaneous, 3-band images at ~30 meter res, which loads into a DataArray with the following structure:
Naively, I began feeling out scaling by first writing up a quick and crude simulacrum of the analytical step that I eventually hope to run on the data, then tried to run it globally (with a fixed-size cluster of 400, 8 GB workers). The analysis subsets and combines all 3 bands using raster algebra, coarsens them to ~1km resolution using a sum, then calculates a metric (as a new, output map) that is a linear combination of the coarsened maps. The result does not successfully compute; instead, the process just seems to hang, with the dask dashboard becoming unavailable (404 error) and then the kernel restarting. If the computation succeeded it would produce a result with the structure:
In order to feel out where the scaling limitation was I then tried just scaling things back much further (to an area ~$20^{\circ}\ \times\ 20^{\circ}$ ). Long story short, I found that all of the following cases also cause the kernel to die and restart (in the analytical cases, almost immediately, i.e., within 4-5s of calling
.compute()or equivalent; in the other cases, within ~1-1.5 min). In all cases, these kill the kernel before even launching any work on the workers or creating a task graph:/tmp(this dies with any reasonable cluster arrangement I've tried).mean().compute()on the above input data (this dies with any reasonable cluster arrangement I've tried)When I pared the analysis all the way back to the to the originally mentioned, very small spatial subset (which is about ~$1^{\circ}\ \times\ 1^{\circ}$ , or ~45.80 MiB of input data) it runs successfully, but at that rate I would be better off just running everything on my laptop.
Based on my reading of all the MSPC docs and examples it definitely seems like a MSPC dask cluster should be able to do much more than this, and like I should not have to wind up manually mapping parallel operations over many small spatial tiles. Given that I had to prep and set up all this data myself, I feel pretty certain that I'm the problem here, but I'm really not sure where I'm going wrong. Perhaps I've just done a poor job optimizing everything, or done something dramatically wrong? Is it possible that this is a Jupyter issue that I would avoid by just submitting a batch job (which is the workflow I'll eventually wind up using anyhow)? Any suggestions for next steps to debug the scaling?
(I should mention that I hoped to try to run the notebook in
--debugmode to gather some more info on what's going on when the kernel dies, but I couldn't figure out how to do that in the MSPC Hub.)Thanks in advance for any input and support!
Drew
Beta Was this translation helpful? Give feedback.
All reactions