Suggestion: stack bar chart in Solar Production card #10028
-
|
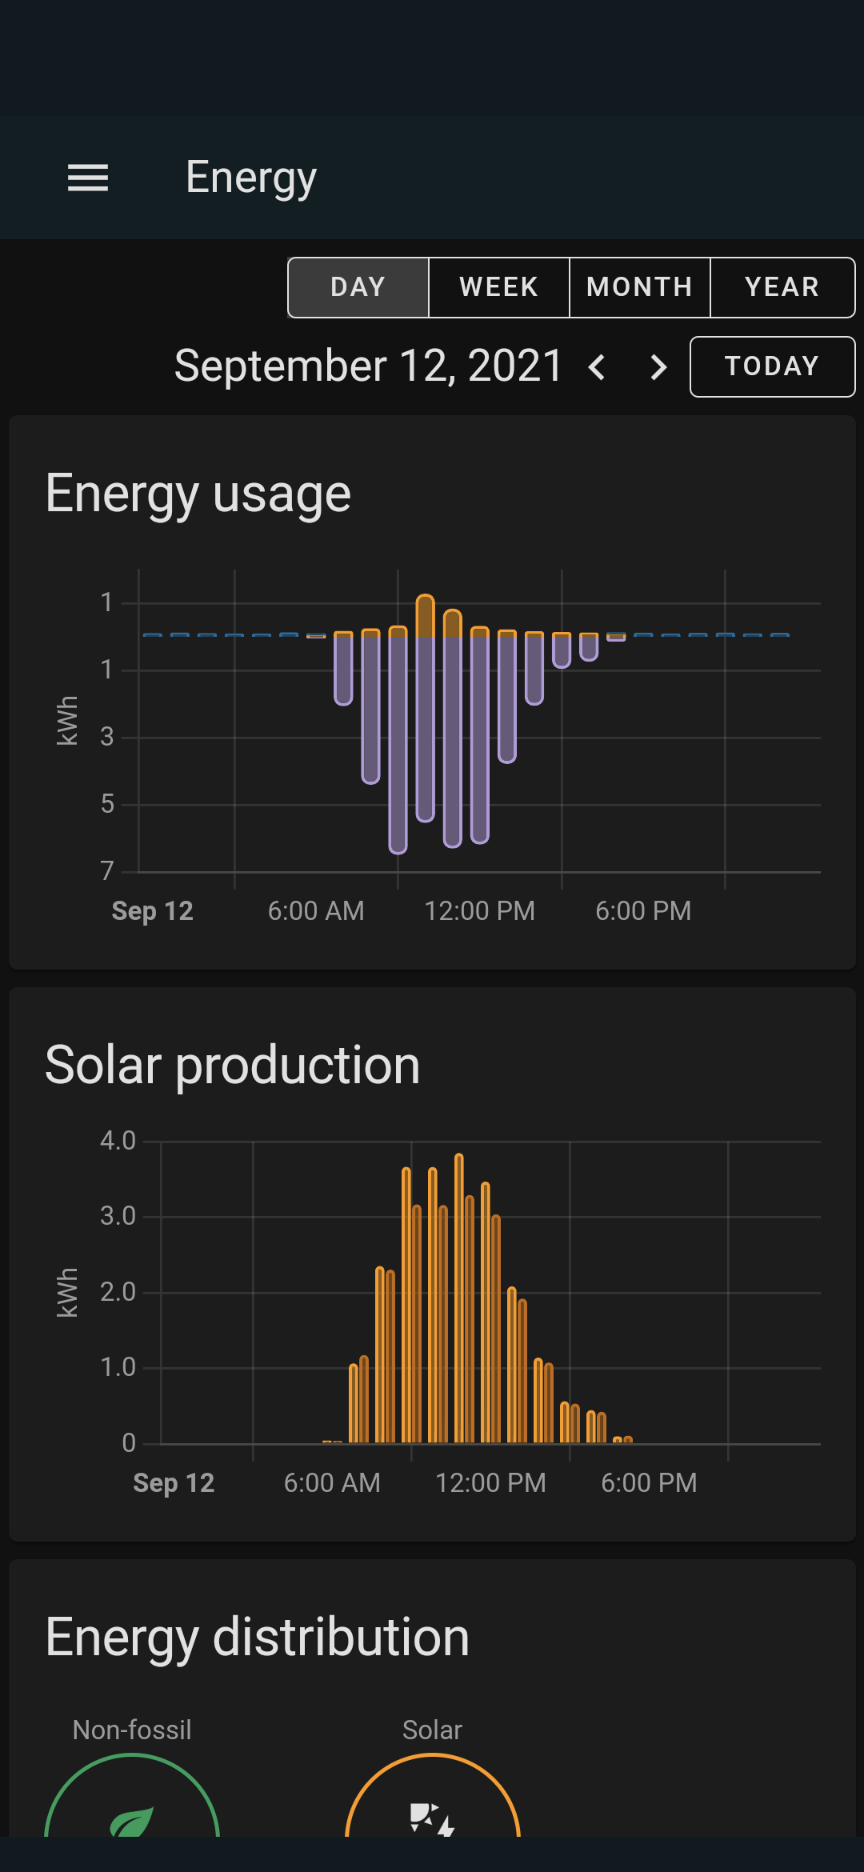
The energy monitoring allows multiple solar production sources which is great as I have two inverters that report production separately. However the solar production card doesn't stack these values, but rather places them side by side.
It would be useful if these could be stacked to show total production for the relevant time interval. |
Beta Was this translation helpful? Give feedback.
Answered by
purcell-lab
Nov 28, 2021
Replies: 1 comment
-
|
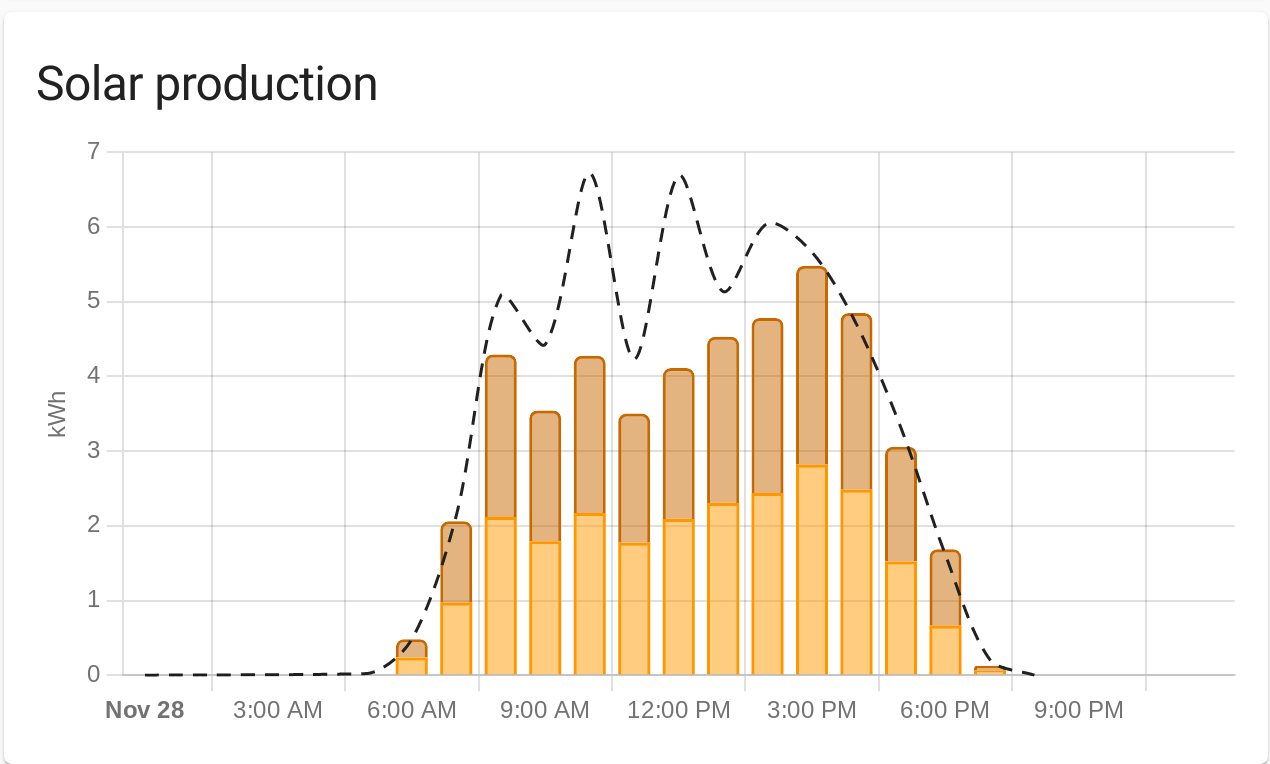
This has been addressed in 2021.11. Thanks for the update.
|
Beta Was this translation helpful? Give feedback.
0 replies
Answer selected by
purcell-lab
Sign up for free
to join this conversation on GitHub.
Already have an account?
Sign in to comment
This has been addressed in 2021.11.
Thanks for the update.