-
-
Notifications
You must be signed in to change notification settings - Fork 407
Open
Labels
type: bugSomething isn't correct or isn't workingSomething isn't correct or isn't working
Milestone
Description
ALL software version info
holoviews 1.14.4 pyhd3eb1b0_1
matplotlib 3.3.4 py39h06a4308_0
python 3.9.5 h12debd9_4
Ubuntu 20.04.2 LTS
Description of expected behavior and the observed behavior
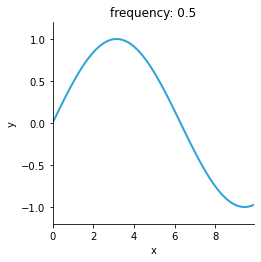
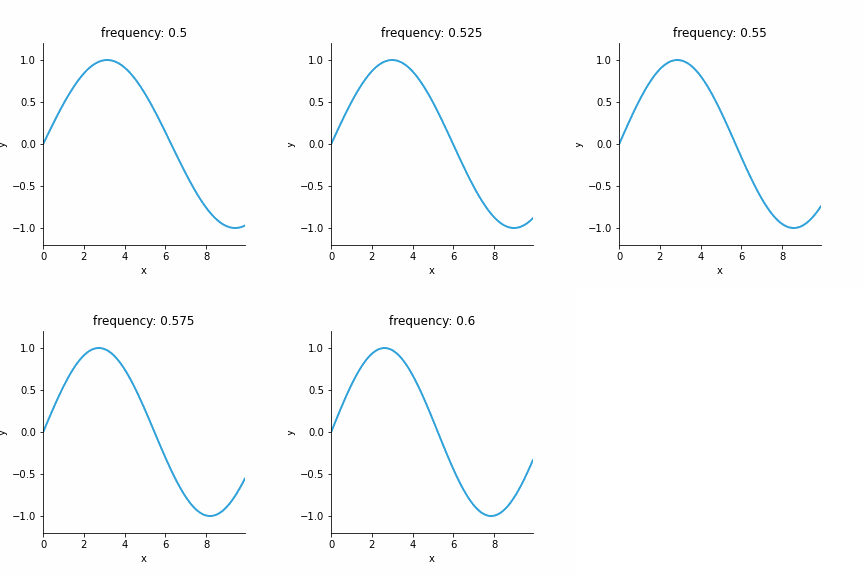
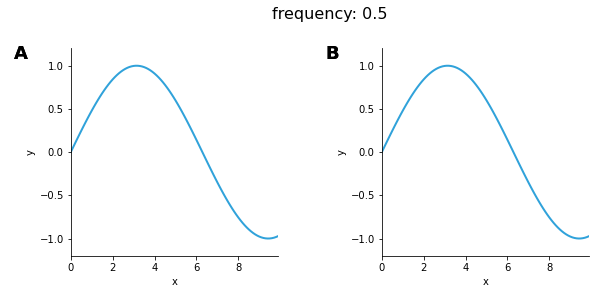
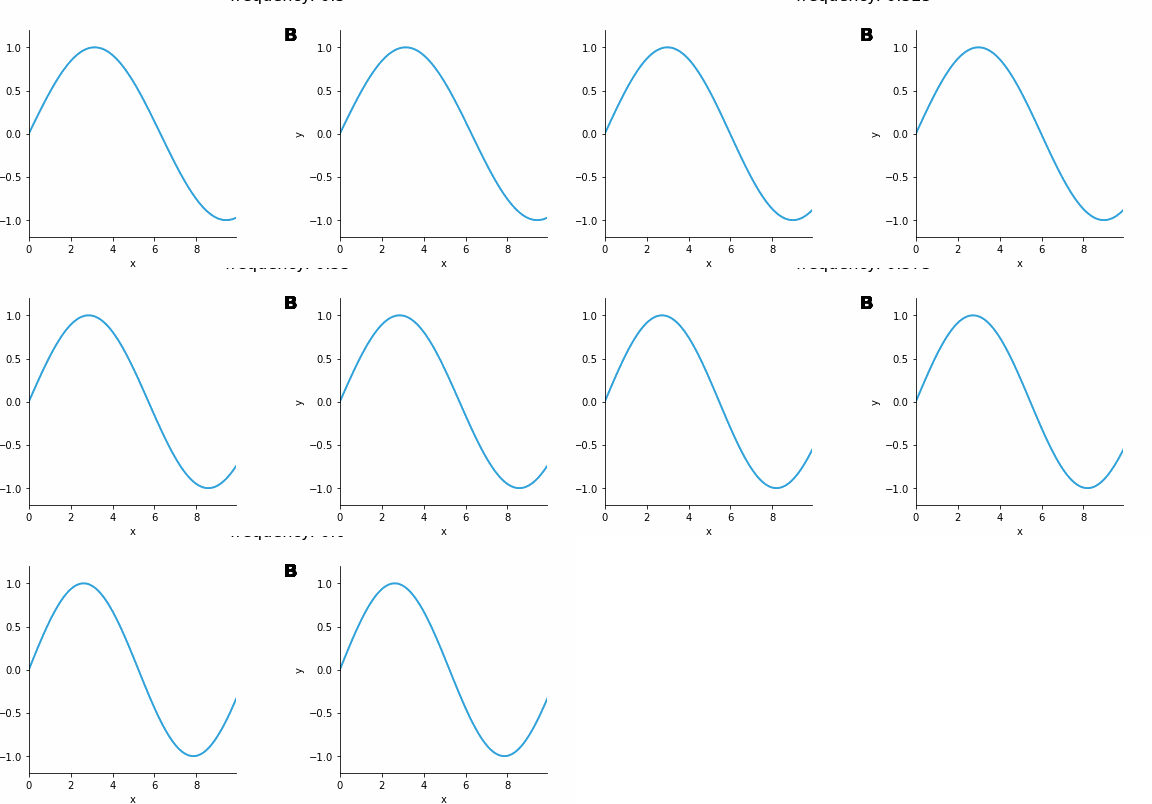
When plotting an animation with the matplotlib backend, the edges of the figure are clipped. This happens for both gif and webm animations. When saving the same figure to a static figure such as png, the edges are not clipped.
Complete, minimal, self-contained example code that reproduces the issue
import holoviews as hv
import numpy as np

hv.extension("matplotlib")

frequencies = np.linspace(0.5, 0.6, 5)

def sine_curve(phase, freq):
    xvals = [0.1* i for i in range(100)]
    return hv.Curve((xvals, [np.sin(phase+freq*x) for x in xvals]))

curve_dict = {f:sine_curve(0,f) for f in frequencies}
hmap = hv.HoloMap(curve_dict, kdims='frequency')

hv.save(hmap, 'sines.webm', fmt='webm')
hv.save(hmap, 'sines.gif', fmt='gif', fps=5)
hv.save(hmap, 'sines.png', fmt='png')

layout = hmap + hmap
hv.save(layout, 'sines_layout.webm', fmt='webm')
hv.save(layout, 'sines_layout.gif', fmt='gif', fps=5)
hv.save(layout, 'sines_layout.png', fmt='png')
Screenshots or screencasts of the bug in action
sines.png file showing no clipping

sines.gif files showing clipping of the y-label, and a wide right margin

Same as above for a layout. Here the clipping is even more clear, affecting the title in addition to the left and lower margins

trianta2 and ChrisZonghaoLi
Metadata
Metadata
Assignees
Labels
type: bugSomething isn't correct or isn't workingSomething isn't correct or isn't working
