Gallery

<img src="https://raw.github.com/fidelram/deepTools/master/gallery/hm_TATA_thumb.png"/ Title="Heatmap of TATA scores around mouse gene TSS">
<img src="https://raw.github.com/fidelram/deepTools/master/gallery/hm_GC_thumb.png"/ Title="GC content for fly and mouse genes">
<img src="https://raw.github.com/fidelram/deepTools/master/gallery/hm_CpG_thumb.png"/ Title="GC content for fly and mouse genes">
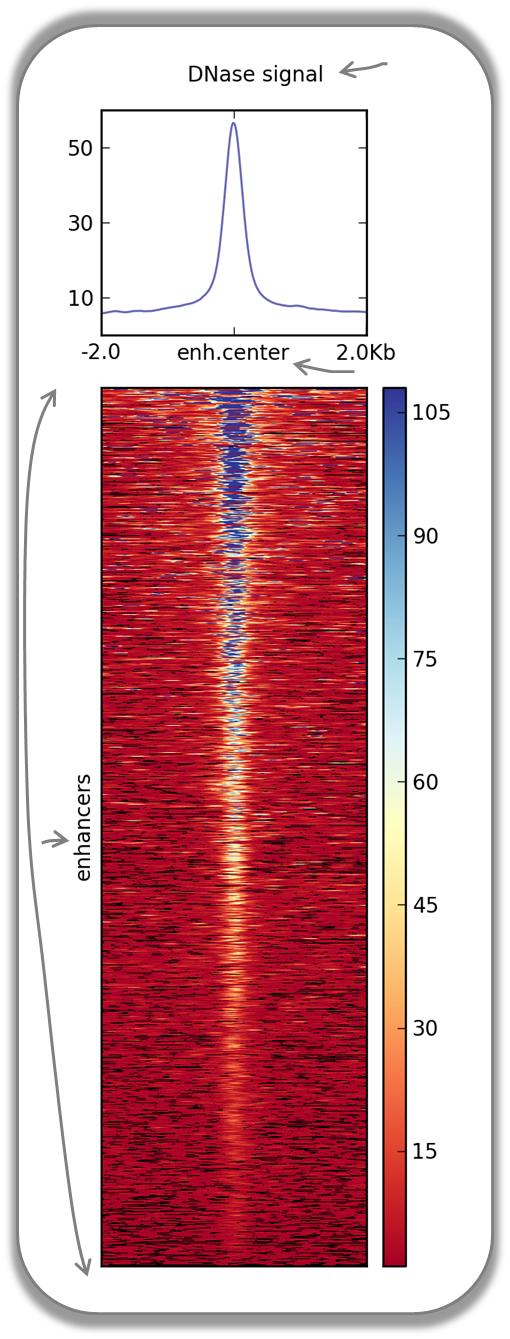
The following image demonstrates that enhancer regions are typically small stretches of highly accessible chromatin (more information on enhancers can be found, for example, here). In the heatmap, yellow and blue color tiles indicate large numbers of reads that were sequenced (which is indicative of open chromatin), black spots indicate missing data points. An appropriate labeling of the y-axis was neglected.
<img src="https://raw.github.com/fidelram/deepTools/master/gallery/hm_DNase.png"/ Title="Heatmap of TATA scores around mouse gene TSS" width="400">
| Fast Facts | |
|---|---|
| computeMatrix mode | reference-point |
| regions file | BED file with typical enhancer regions from Whyte et al., 2013 (download here) |
| signal file | bigWig file with DNase signal from UCSC |
| heatmap cosmetics | labels, titles, heatmap height |
$ deepTools-1.5.7/bin/computeMatrix reference-point \
 -S DNase_mouse.bigwig \
 -R Whyte_TypicalEnhancers_ESC.bed \
 --referencePoint center \
 -a 2000 -b 2000 \ ## regions before and after the enhancer centers
 -out matrix_Enhancers_DNase_ESC.tab.gz

$ deepTools-1.5.7/bin/heatmapper \
 -m matrix_Enhancers_DNase_ESC.tab.gz\
 -out hm_DNase_ESC.png \
 --heatmapHeight 15  \
 --refPointLabel enh.center \
 --regionsLabel enhancers \
 --plotTitle 'DNase signal' \
<img src="https://raw.github.com/fidelram/deepTools/master/gallery/hm_TATA.png"/ Title="Heatmap of TATA scores around mouse gene TSS" width="400">
| Fast Facts | |
|---|---|
| computeMatrix mode | reference-point |
| regions file | BED file with all mouse genes (from UCSC table browser) |
| signal file | bigWig file of TATA psem scores |
| heatmap cosmetics | color scheme, labels, titles, color for missing data was set to grey, heatmap height, regions sorted ascendingly, only showing heatmap + colorbar |
The bigWig file of motif scores was generated using the TRAP suite.
$ deepTools-1.5.7/bin/computeMatrix reference-point \
 -S TATA_01_pssm.bw \
 -R RefSeq_genes.bed \
 --referencePoint TSS \
 -a 100 -b 100 \
 --binSize 5 \

$ deepTools-1.5.7/bin/heatmapper \
 -m matrix_Genes_TATA.tab.gz  \
 -out hm_allGenes_TATA.png \
 --colorMap hot_r \
 --missingDataColor .4 \
 --heatmapHeight 7 \
 --plotTitle 'TATA motif' \
 --whatToShow 'heatmap and colorbar' \
 --sortRegions ascend
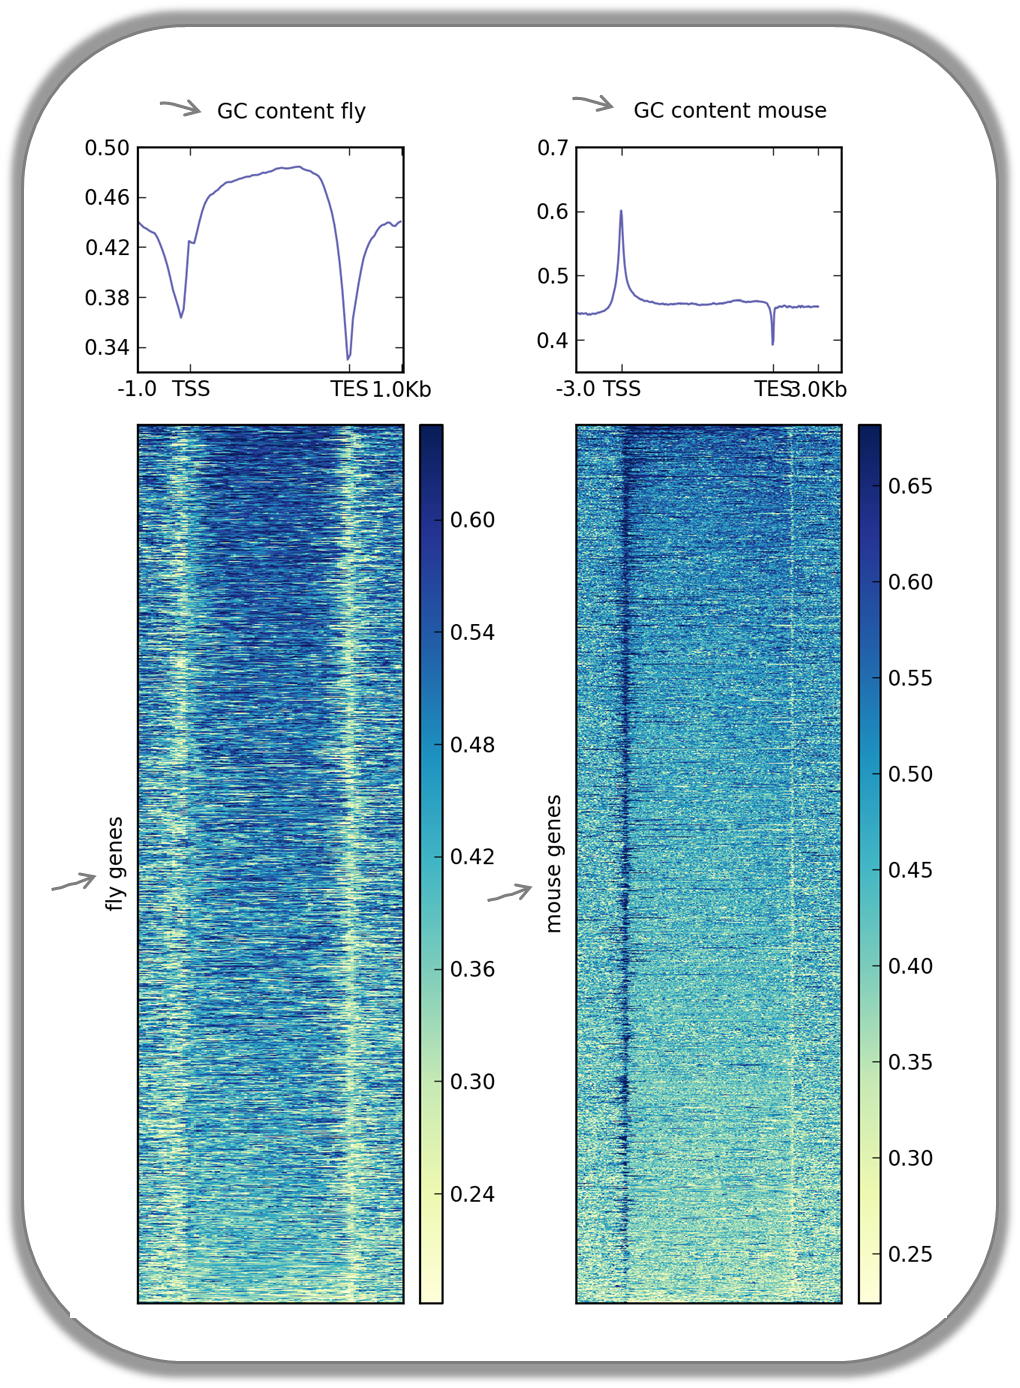
It is well known that different species have different genome GC contents. Here, we used two bigWig files where the GC content was calculated for 50 bp windows along the genome of mice and flies and visualized the scores for gene regions. You can find the bigWig files in our Galaxy's data library.
The images nicely illustrate the completely opposite GC distributions in flies and mice: while the gene starts of mammalian genomes are enriched for CpGs, fly promoters show depletion of GC content.
<img src="https://raw.github.com/fidelram/deepTools/master/gallery/hm_GC.png"/ Title="Heatmaps of GCcontent for fly and mouse genes" width="400">
| Fast Facts | |
|---|---|
| computeMatrix mode | scale-regions |
| regions files | BED files with mouse and fly genes (from UCSC table browser) |
| signal file | bigWig files with GC content |
| heatmap cosmetics | color scheme, labels, titles, color for missing data was set to white, heatmap height |
Fly and mouse genes were scaled to different sizes due to the different median sizes of the two species' genes (genes of D.melanogaster contain much fewer introns and are considerably shorter than mammalian genes). Thus, computeMatrix had to be run with slightly different parameters while the heatmapper commands were virtually identical (except for the labels).
$ deepTools-1.5.7/bin/computeMatrix scale-regions \
 -S GCcontent_Mm9_50_5.bw \
 -R RefSeq_genes_uniqNM.bed \
 -bs 50
 -m 10000 -b 3000 -a 3000 \
 -out matrix_GCcont_Mm9_scaledGenes.tab.gz \
 --skipZeros \
 --missingDataAsZero

$ deepTools-1.5.7/bin/computeMatrix scale-regions \
 -S GCcontent_Dm3_50_5.bw \
 -R Dm530.genes.bed \
 -bs 50
 -m 3000 -b 1000 -a 1000 \
 -out matrix_GCcont_Dm3_scaledGenes.tab.gz \
 --skipZeros --missingDataAsZero

$ deepTools-1.5.7/bin/heatmapper \
 -m matrix_GCcont_Dm3_scaledGenes.tab.gz \
 -out hm_GCcont_Dm3_scaledGenes.png \
 --colorMap YlGnBu \
 --regionsLabel 'fly genes' \
 --heatmapHeight 15 \
 --plotTitle 'GC content fly' &

$ deepTools-1.5.7/bin/heatmapper \
 -m matrix_GCcont_Mm9_scaledGenes.tab.gz \
 -out hm_GCcont_Mm9_scaledGenes.png \
 --colorMap YlGnBu \
 --regionsLabel 'mouse genes' \
 --heatmapHeight 15 \
 --plotTitle 'GC content mouse' &
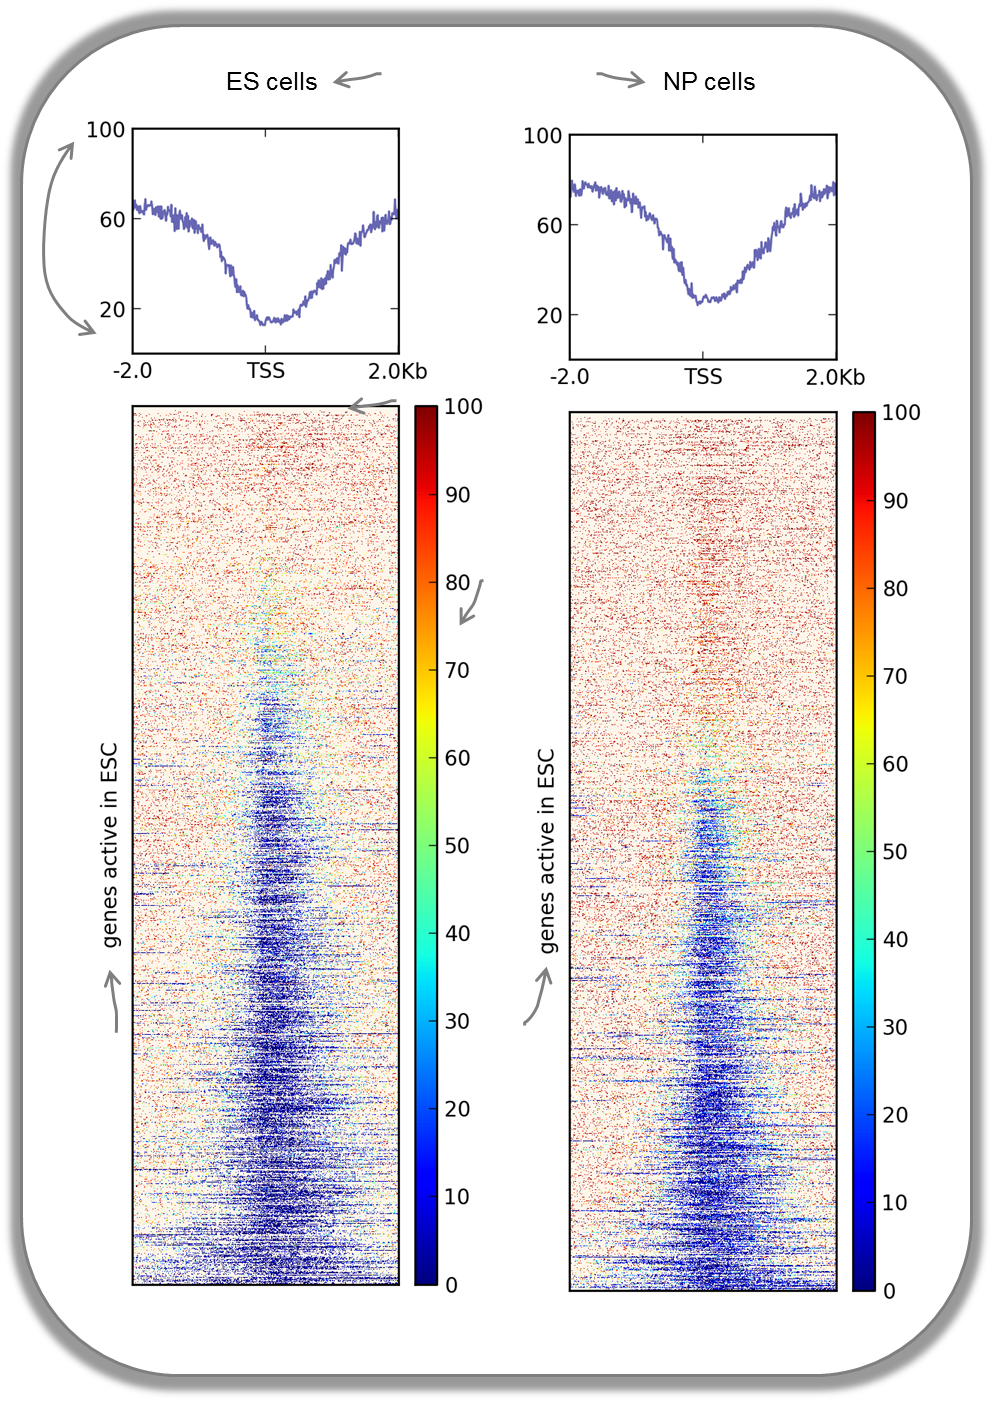
In addition to the methylation of histone tails, the cytosine of DNA itself can also be methylated (for more information on CpG methylation, read [here][http://www.nature.com/scitable/topicpage/the-role-of-methylation-in-gene-expression-1070]). In mammalian genomes, roughly 80% of CpG occurrences are methylated except for gene promoters that need to be kept unmethylated to show full transcriptional activity. In the following heatmaps, we used genes that were determined to be expressed primarily in ES cells and checked the percentages of methylated cytosines around their transcription start sites. The blue signal indicates that very few methylated cytosines are found. When you compare the CpG methylation signal between ES cells and NP cells, you can see that the majority of genes remains unmethylated, but the general amount of CpG methylation around the TSSs increases as indicated by the stronger red signal and the slight elevation in the summary plot.
DNA methyltransferases 70-80% CpG cytosines are methylated generally CpGs occur less frequently than expected which has been proposed to be an evolutionary response to the increased risk of spontaenous deamination (which will produce a thymine in place of a ) <img src="https://raw.github.com/fidelram/deepTools/master/gallery/hm_CpG.png"/ Title="Heatmaps CpG methylation percentages around the TSS of ESC-active genes" width="400">
| Fast Facts | |
|---|---|
| computeMatrix mode | reference-point |
| regions files | BED file mouse genes expressed in ES cells |
| signal file | bigWig files with fraction of methylated cytosins (from Stadler et al., 2011) |
| heatmap cosmetics | color scheme, labels, titles, color for missing data was set to customized color, y-axis of profiles were changed, heatmap height |
The commands for the bigWig files from the ES cell and NP cell sample were the same:
$ deepTools-1.5.7/bin/computeMatrix reference-point \
 -S GSE30202_ES_CpGmeth.bw \
 -R activeGenes_ESConly.bed \
 --referencePoint TSS \
 -a 2000 -b 2000 \
 -out matrix_Genes_ES_CpGmeth.tab.gz

$ deepTools-1.5.7/bin/heatmapper \
 -m matrix_Genes_ES_CpGmeth.tab.gz \
 -out hm_activeESCGenes_CpG_ES_indSort.png \
 --colorMap jet \
 --missingDataColor "#FFF6EB" \
 --heatmapHeight 15 \
 --yMin 0 --yMax 100 \
 --plotTitle 'ES cells' \
 --regionsLabel 'genes active in ESC'
[read]: https://github.com/fidelram/deepTools/wiki/Glossary#terminology "the DNA piece that was actually sequenced ("read") by the sequencing machine (usually between 30 to 100 bp long, depending on the read-length of the sequencing protocol)" [input]: https://github.com/fidelram/deepTools/wiki/Glossary#terminology "confusing, albeit commonly used name for the 'no-antibody' control sample for ChIP experiments"