This repository was archived by the owner on Dec 17, 2024. It is now read-only.
-
|
I cannot see where they are set for each metric |
Beta Was this translation helpful? Give feedback.
Answered by
markwort
Feb 21, 2022
Replies: 1 comment
-
|
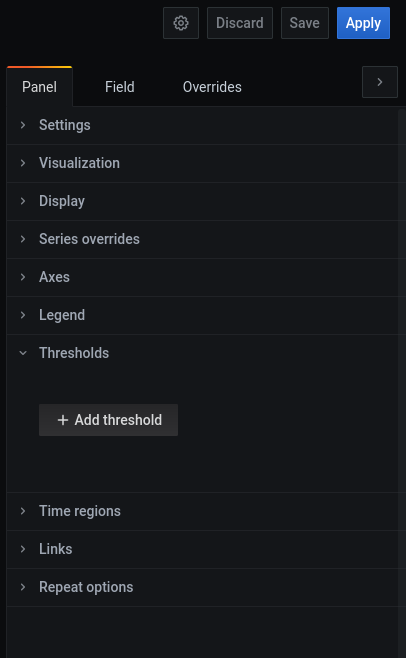
do you mean this? That is accessible if you choose a graph in grafana, then press If this does not solve what you're looking for, perhaps you can show a screenshot of what you're looking for? best regards |
Beta Was this translation helpful? Give feedback.
0 replies
Answer selected by
pashagolub
Sign up for free
to join this conversation on GitHub.
Already have an account?
Sign in to comment
do you mean this?
That is accessible if you choose a graph in grafana, then press
editand then it should be on the right in this panel.I don't think there are predefined values in all diagrams.
If this does not solve what you're looking for, perhaps you can show a screenshot of what you're looking for?
best regards
Julian