Is there a single Derived Chart Type Example? #9880
-
|
I want to custom draw the data points of a scatter chart(could be bubble, I don't care). There is an example, but I can't find the full working source code anywhere, and maybe it's me. Can anyone point me to a full working example using Chart.js 3.x? |
Beta Was this translation helpful? Give feedback.
Replies: 5 comments 2 replies
-
|
https://www.chartjs.org/docs/master/samples/advanced/derived-chart-type.html Last codeblock shows how to create the derived chart type, after that you use the id you gave it as the chart type when calling new chart |
Beta Was this translation helpful? Give feedback.
-
|
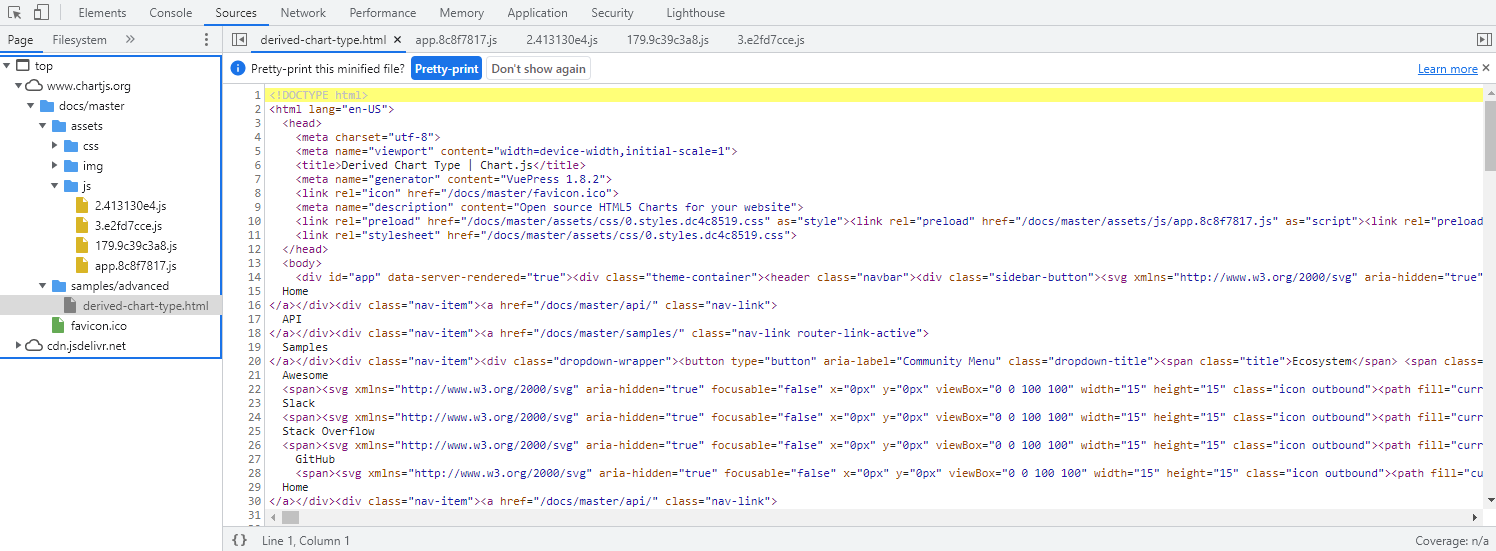
I'll try it, but it's confusing why an example that takes one html file to demonstrate has so much going on, and no clear way to debug it. |
Beta Was this translation helpful? Give feedback.
-
|
I fully understand, but it does leave a gap in understanding how to use this in the real world. There is so much confusion around this as witnessed by the many questions in the issues, compounded by the changes between version 2.x to 3.x. So I know it's hard for you as individuals to change much... it is what it is. |
Beta Was this translation helpful? Give feedback.
-
|
BTW, is there a version I need to be on to get the export? I'm using version 3.01, and I get the error: Uncaught SyntaxError: The requested module 'https://cdnjs.cloudflare.com/ajax/libs/Chart.js/3.0.1/chart.min.js' does not provide an export named 'BubbleController' |
Beta Was this translation helpful? Give feedback.
-
|
Yes, it works a treat, however it bears little resemblance to the sample you showed me, which used ES6 modules. This one uses standard extension of a class, which was discussed in the issues as needing to be shown also, but never seemed to make it to samples. Having said that, I will keep this for future reference, I may need it. For now, I've solved my problem using AfterDraw and some direct canvas drawing. However, thank you very much for your patience and effort, it's greatly appreciated! |
Beta Was this translation helpful? Give feedback.

https://www.chartjs.org/docs/master/samples/advanced/derived-chart-type.html
Last codeblock shows how to create the derived chart type, after that you use the id you gave it as the chart type when calling new chart