Flipping a Bar Chart to a Column Chart #9611
Unanswered
CarlRevell
asked this question in
Q&A
Replies: 0 comments
Sign up for free
to join this conversation on GitHub.
Already have an account?
Sign in to comment
Uh oh!
There was an error while loading. Please reload this page.
Uh oh!
There was an error while loading. Please reload this page.
-
Is there a simple method to flip a bar chart into a column chart, nicely animated without destroying the Chart and re-creating using a slightly modified config object?
I have tried doing a
chart.config.options.indexAxis ='y'; chart.update();andchart.config.options.indexAxis ='x'; chart.update();and sure enough the chart switches from bar to column (and vice versa), animating nicely but the axis, scales, values, gridlines, ticks are subsequently incorrect (see attachments).The original bar chart has a linear scale (£s) along
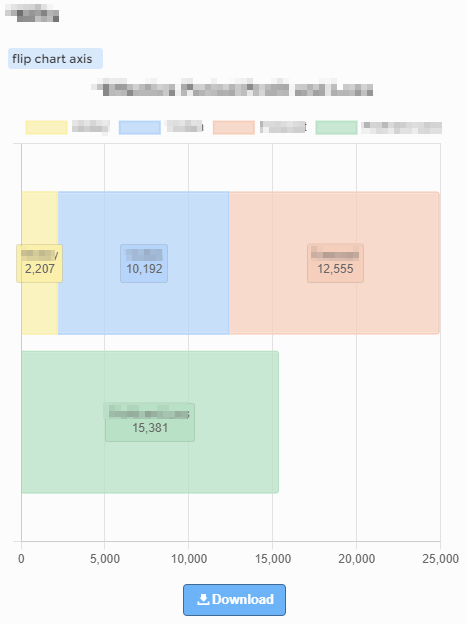
x, and a text category alongy; both axis are stacked.I have meticulously gone in and fiddled around with
.type,.offset,.beginAtZero,.ticks.display,.grid.displayfor bothxandyaxis in my flip code and have come close (gridlines and ticks are not quite in the right place for the column chart) but it doesn't seem a very robust way of doing this.Here's the starting bar chart...
Here's the column after calling
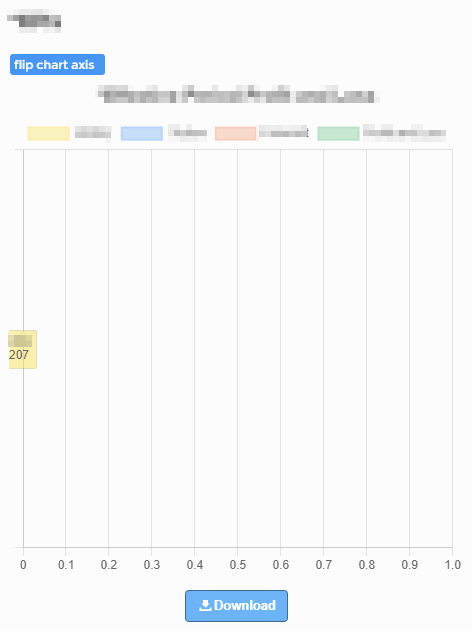
chart.config.options.indexAxis ='x'; chart.update();Here's the column chart I can get close to if I manually manipulate a bunch of options before calling
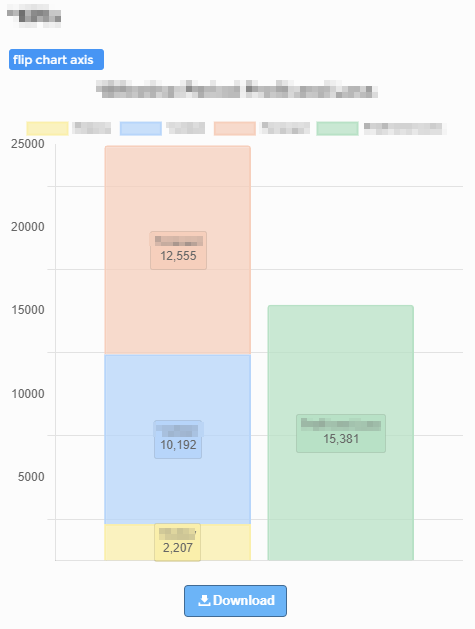
chart.update()but it doesn't seem very robust to do this (maybe I've missed some too?) and the y axis grid lines aren't quite correct.Beta Was this translation helpful? Give feedback.
All reactions