Replies: 4 comments
-
|
The slack link should work again next month, for these kind of questions please go to stackoverflow as the issue template points out.
|
Beta Was this translation helpful? Give feedback.
-
|
This what I did, no answer yet ;-) https://stackoverflow.com/questions/68547969/chart-js-line-chart-max-on-100 |
Beta Was this translation helpful? Give feedback.
-
|
Well wont expect that within 2 minutes, but afaik there is no plugin for this so you will just need to transform your own data beforehand by looking for the highest number and calculate the percentages from that and then pass that to chart.js |
Beta Was this translation helpful? Give feedback.
-
|
The problem of you solution is that I need to make this each time a dataset is hidden thanks to a click on the legend... |
Beta Was this translation helpful? Give feedback.
Uh oh!
There was an error while loading. Please reload this page.
-
Hi all,
Sorry, but the slack link is not working anymore : https://chartjs-slack.herokuapp.com/ 😢
So I'm trying to ask here...
I'm looking to a feature, but I don't know if it exists with Chart.js on a plugin.
I have three datasets as following:

The thing is that I don't want to display it like this, with a max point on 19, in my example. But I want that my highest point is considered as 100 and all the other points placed according to highest point. In fact, I'm trying to reproduce the Google Trends behavior, but I'm wondering is a plugin could compute datasets instead of making it myself.
Google Trend example:
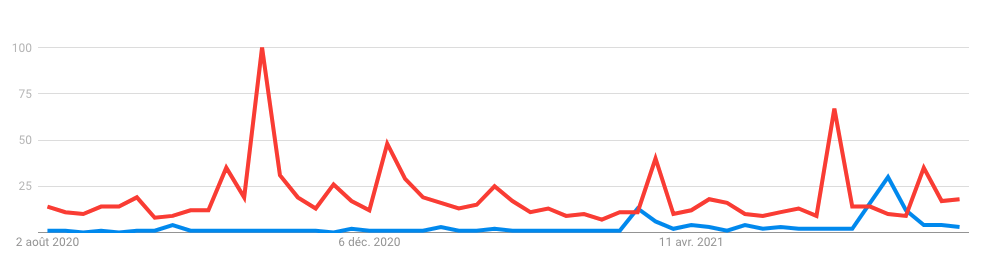
Could anyone help me or give me some advice?
Thanks a lot!
Beta Was this translation helpful? Give feedback.
All reactions