line graph will not start at zero or first tick as minimum value #9029
Replies: 2 comments 3 replies
-
|
I don't understand the problem, but maybe |
Beta Was this translation helpful? Give feedback.
-
|
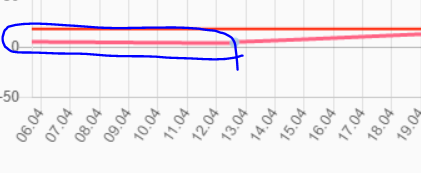
Reading third time, is this the problem (missing from the "month" view)?:
If it is, you need to alter the "ajax" thing to return the previous point too, that is most likely outside the date range. Or you need to interpolate a value at the |
Beta Was this translation helpful? Give feedback.
-
|
I apologize for misleading you. I need to pad a chart line from 0 to the first value |
Beta Was this translation helpful? Give feedback.
-
|
|
Beta Was this translation helpful? Give feedback.
-
|
Chart.js displays the data, it does not manipulate it. You need to manipulate it the way you want. |
Beta Was this translation helpful? Give feedback.
Uh oh!
There was an error while loading. Please reload this page.
Uh oh!
There was an error while loading. Please reload this page.
-
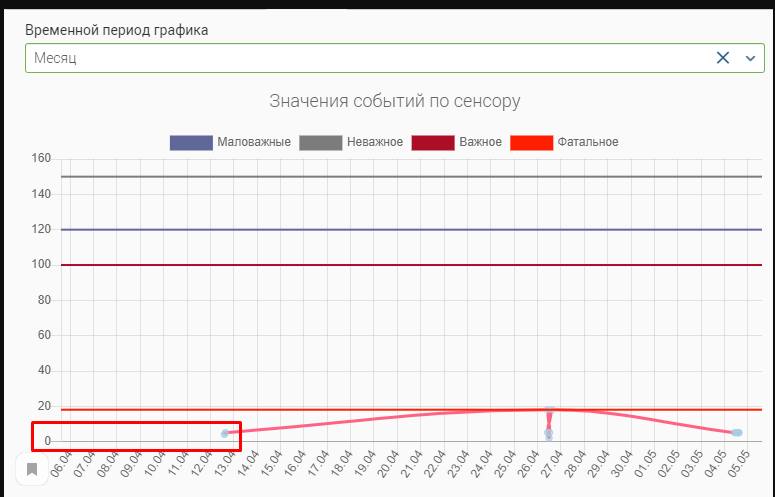
Current chart
A little explanation: My graph is built on a given time interval. The time interval is calculated depending on the selected item in the drop-down list. Now the interval is set to "month".
The line starts its path from the point where the first value appeared. I tried to make exactly the same graph on codepen, but the graph starts its way from the zero point.
How i can draw a graph line from zero to the first value so that the graph looks normal?
Example on Codepen
And my current chart options
beginAtZero: true - doesn't work, I've tested it so many times, and for the y axis too.
Beta Was this translation helpful? Give feedback.
All reactions