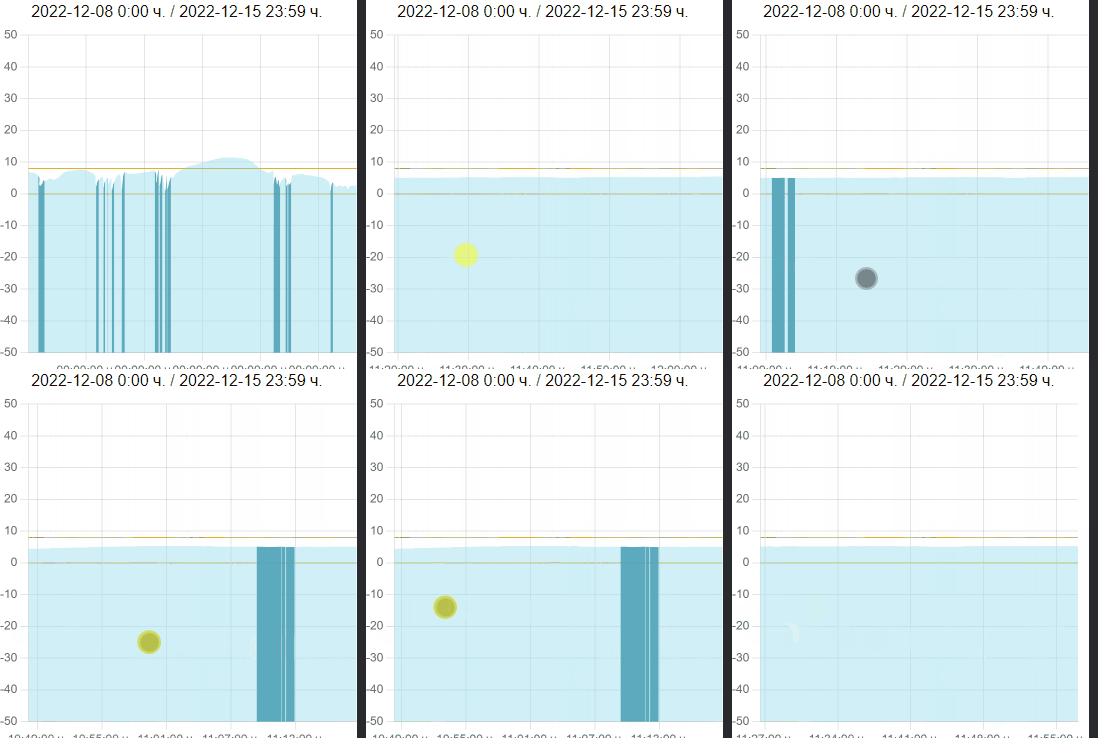
Line chart lags on bigger zoom #10981
Unanswered
MariyanEOD
asked this question in
Q&A
Replies: 0 comments
Sign up for free
to join this conversation on GitHub.
Already have an account?
Sign in to comment
Uh oh!
There was an error while loading. Please reload this page.
Uh oh!
There was an error while loading. Please reload this page.
-
It is combined with Angular 14 (If this helps)
The libraries:
the config is:
I will provide a recording of the issue. It is done with about 12k points but it is the same with 1,4k data points.

The chart has a total of 3 datasets, the first one is the main one with the ton of points, the second and third are the yellow lines that has 2 datapoints that are connected using
spanGap: true.It could be partially fixed by limiting the zoom to 13 hours(46800000 ms) but i need bigger zoom for bigger details.
EDIT: I managed to find the problem! It was the
segmentproperty however i need it working for my purpose but the lag is also big.Seems like the Data Decimation shuts off at some point with bigger zoom and the segment functions run for every point.
Beta Was this translation helpful? Give feedback.
All reactions