How to show the center X-axis for Positive and Negative value graph? #10732
Unanswered
ManikandanS8377
asked this question in
Q&A
Replies: 1 comment 1 reply
-
|
Hi @ManikandanS8377 , Are you referring to something like this: https://youtu.be/wijUFALw3tQ Where the zero baseline on the x-scale is always a different color compare to other or remove all of the lines and only show the zero baseline? In that case the video above could help.
|

Beta Was this translation helpful? Give feedback.
1 reply
-
|
@Udemology Thank you for your response, https://www.chartjs.org/docs/latest/samples/scale-options/grid.html |
Beta Was this translation helpful? Give feedback.
Sign up for free
to join this conversation on GitHub.
Already have an account?
Sign in to comment
Uh oh!
There was an error while loading. Please reload this page.
-
In my case,
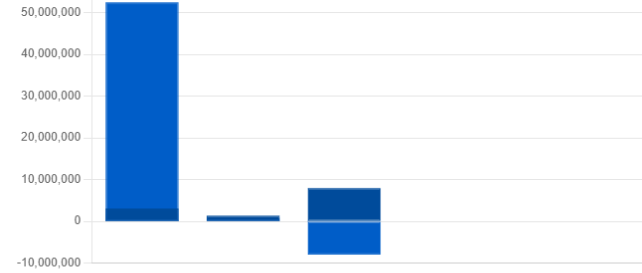
I have user stacked bar graph with positive and negative value cases. I want to show the center of Zeroth X-axis line when the datasets valu has both positive and negative value. I have used borderSkipped property, But this not give effective look. If any other properties there kindly let me know.
Expected Outcome:
If I false the display properties all the border lines will not shown expect 0th value border.
What is Now:
While I am trying to flase the display property all the line has not shown. And using the borderSkipped property just only enable the bottom border only.
Beta Was this translation helpful? Give feedback.
All reactions