You signed in with another tab or window. Reload to refresh your session.You signed out in another tab or window. Reload to refresh your session.You switched accounts on another tab or window. Reload to refresh your session.Dismiss alert
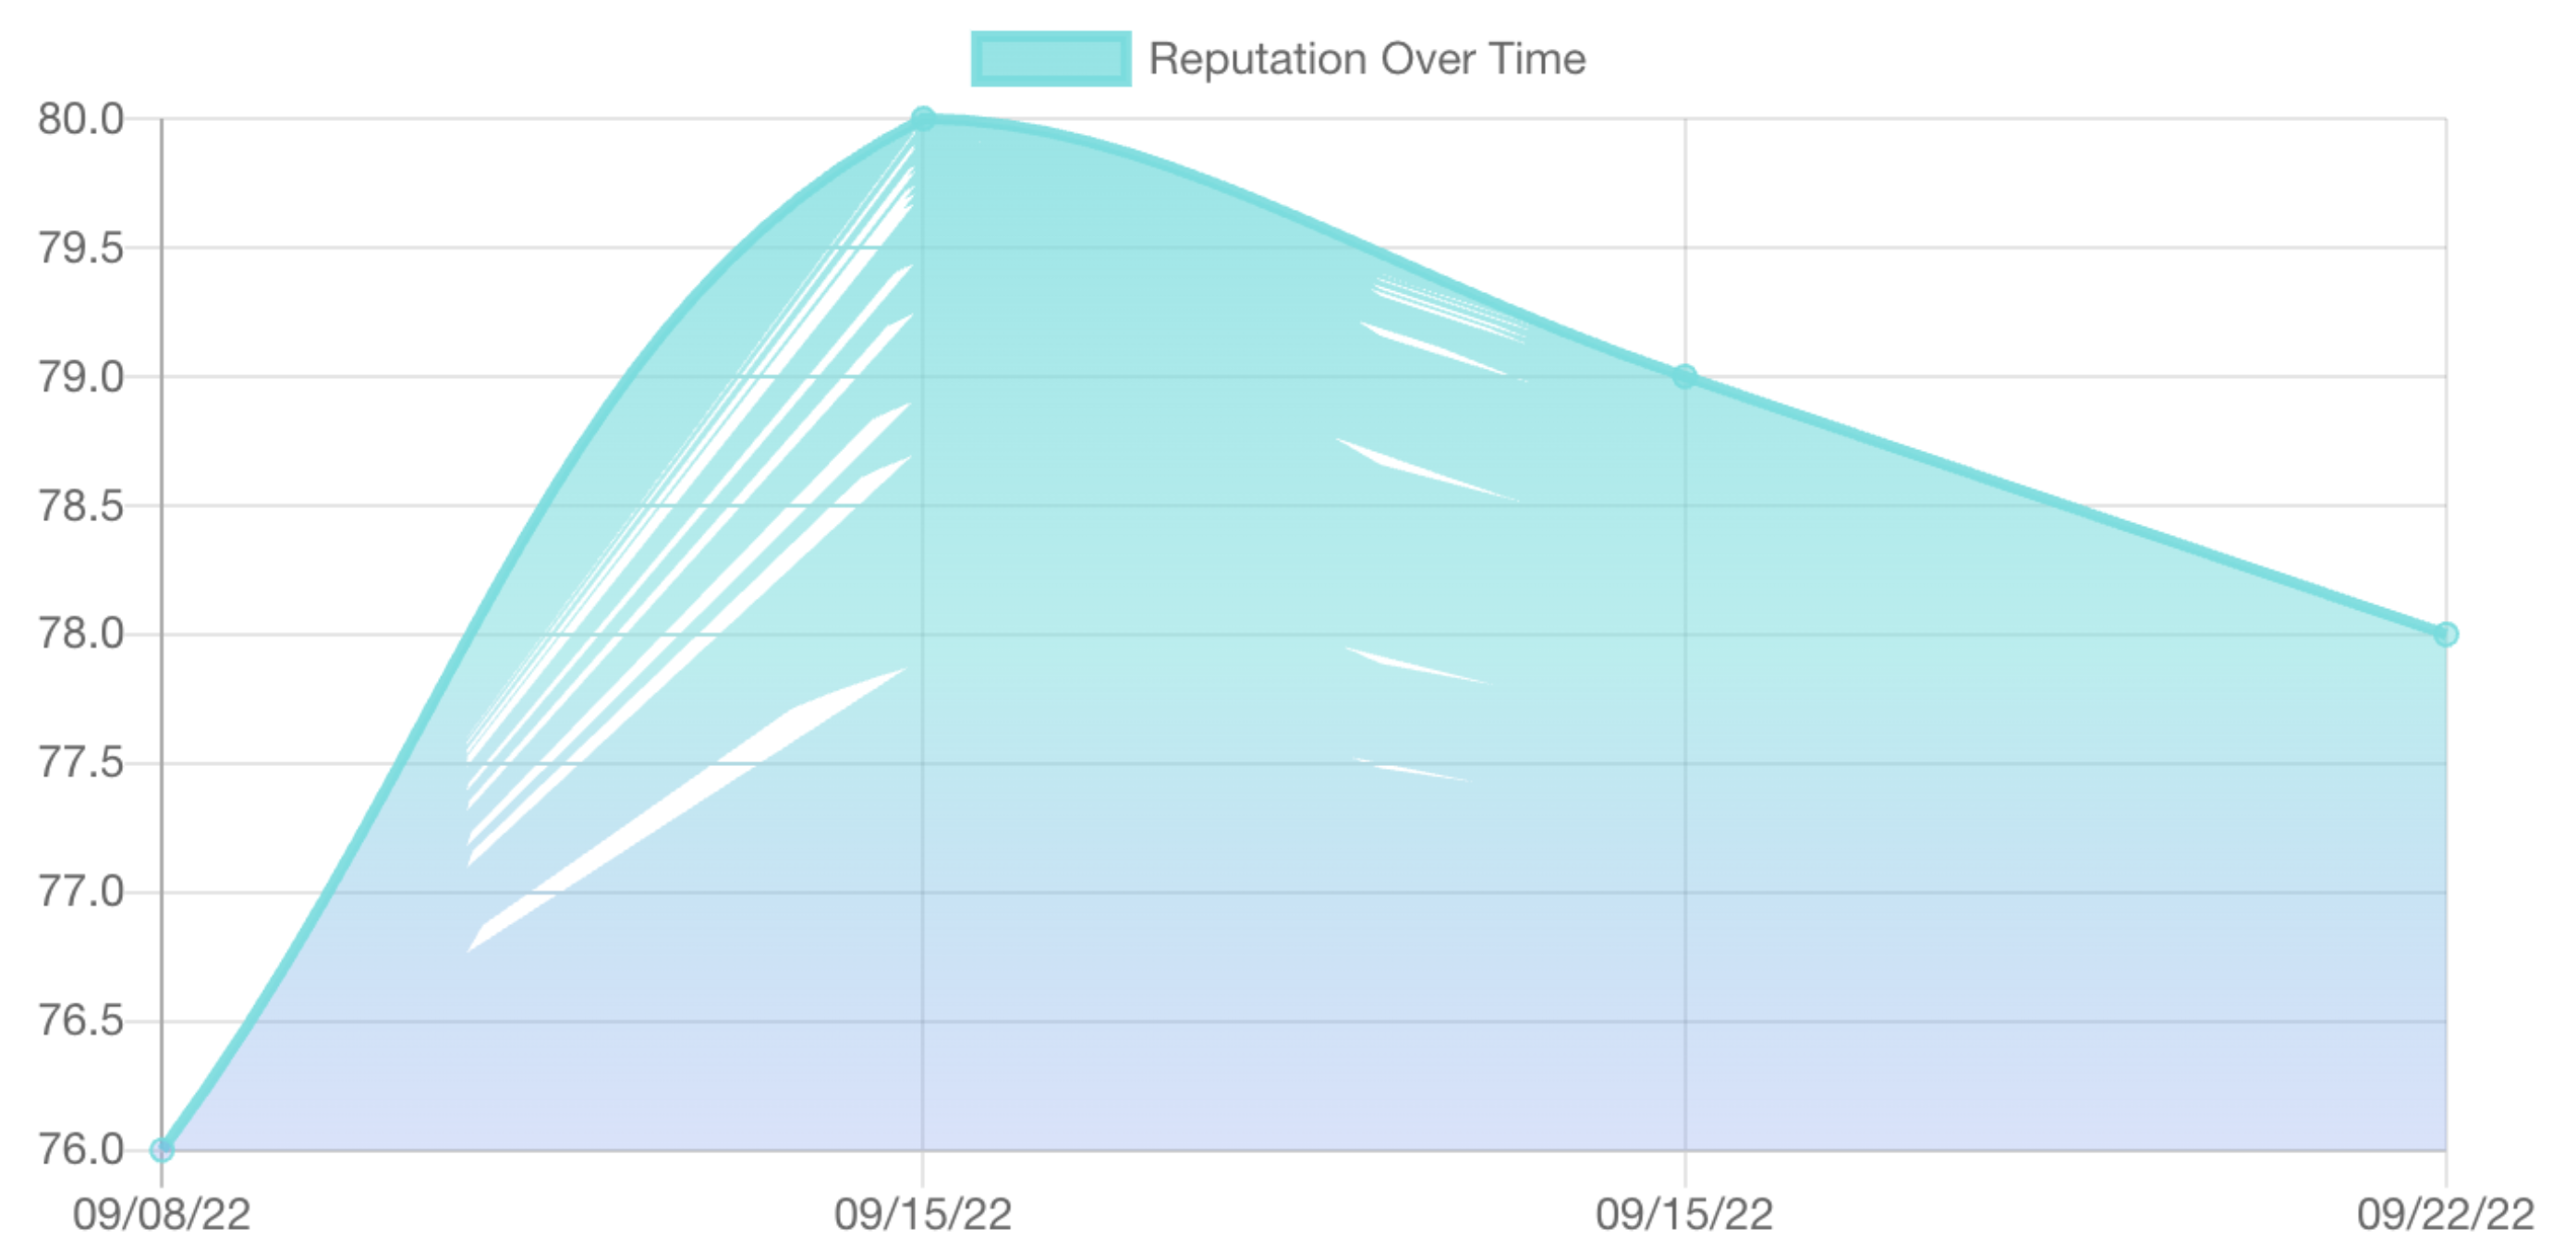
I have configured a simple line chart using chartJS. I noticed that when the graph has steep values the fill of the chart has issues filling the entire graph. Is this due to it being curved and if so, is there documentation on how to fix it?
Below is my code and a screenshot-
` const canvas = document.getElementById('myChart');
const ctx = canvas.getContext('2d');
reacted with thumbs up emoji reacted with thumbs down emoji reacted with laugh emoji reacted with hooray emoji reacted with confused emoji reacted with heart emoji reacted with rocket emoji reacted with eyes emoji
Uh oh!
There was an error while loading. Please reload this page.
-
I have configured a simple line chart using chartJS. I noticed that when the graph has steep values the fill of the chart has issues filling the entire graph. Is this due to it being curved and if so, is there documentation on how to fix it?
Below is my code and a screenshot-
` const canvas = document.getElementById('myChart');
const ctx = canvas.getContext('2d');
var gradient = ctx.createLinearGradient(0, 0, 0, 350);
gradient.addColorStop(0, 'rgba(74, 222, 222, 0.8)');
gradient.addColorStop(0.5, 'rgba(74, 222, 222, 0.5)');
gradient.addColorStop(1, 'rgba(120, 127, 246, 0.2)');
const data = {
labels: {{reputationDateArray | tojson}},
datasets: [{
label: 'Reputation Over Time',
backgroundColor: gradient,
borderColor: 'rgba(74, 222, 222, 0.9)',
fill: true,
data: {{reputationArray}},
}]
};
const config = {
type: 'line',
data: data,
options: {}
};
const myChart = new Chart(
document.getElementById('myChart'),
config
);`
Beta Was this translation helpful? Give feedback.
All reactions