How to create a chart with non-linear scale? #10721
Unanswered
JoaoPedroAS51
asked this question in
Q&A
Replies: 0 comments
Sign up for free
to join this conversation on GitHub.
Already have an account?
Sign in to comment
Uh oh!
There was an error while loading. Please reload this page.
Uh oh!
There was an error while loading. Please reload this page.
-
Hi. I'm trying to create a chart with the initial
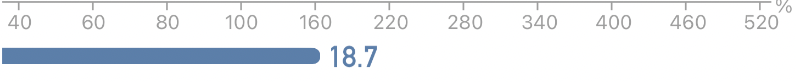
stepSizeset to 20 and after tick 100 it should change to 60, it should start from 40 and end on 520 but the spaces between all ticks must have the same size. I couldn't find a way to do so.My goal is to achieve something similar to this one:
Thank you in advance!
Beta Was this translation helpful? Give feedback.
All reactions