Wrong Data Shown #10586
-
|
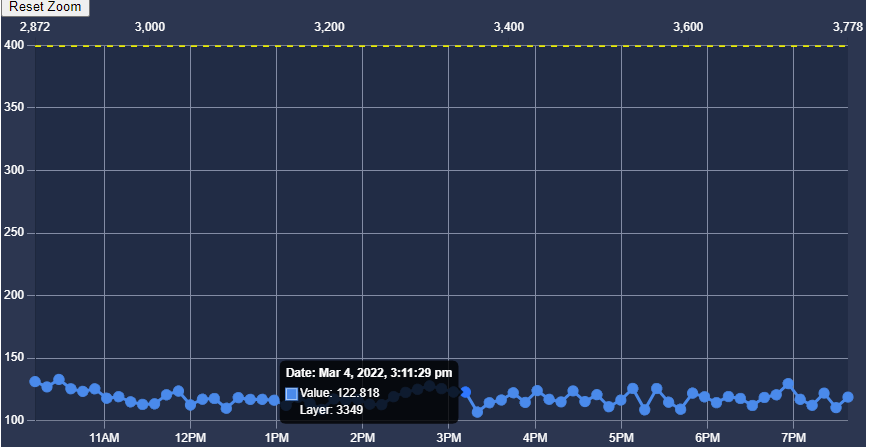
In the above image shown , the top axis is layer axis and and the bottom axis is date . The tooltip is showing accurate result for both date and layer but not matching the above layer axis as the interepretation tells that the point should have layer more than 2000 but is not having it. I tried using the Fetch data in chartjs-plugin-zoom but still shows the same error. Can somebody please help me ?? |

Beta Was this translation helpful? Give feedback.
Replies: 2 comments 12 replies
-
|
Having a look to the picture is not clear the role of the axis on the top. It seems there is only 1 dataset and sounds to be related to time axis. |
Beta Was this translation helpful? Give feedback.
-
|
See in this . It is perfectly aligned |
Beta Was this translation helpful? Give feedback.
-
|
It seems that more you are zooming, more they are aligned (but I don't think they are at same value of the layer). Tomorrow I'll use the sample you provided, clicking on the element and checking the value (at the same pixel) of scale layer, to see if there are the same but I doubt it |
Beta Was this translation helpful? Give feedback.
-
|
I spent a couple of minutes more. Another test. I show the gridline of layer instead of x scale. And I zoom in deep and as you can see it doesn't work. The layer 3603 before the line 3600. Anyway and I'm sorry, I think it will not work as you want.
|

Beta Was this translation helpful? Give feedback.
-
|
I agree I won't get the result I want but at least in the latest photo u sent it is extremely close. But in the original photo I uploaded it is extremely far |
Beta Was this translation helpful? Give feedback.
-
|
I think the layer scale should show ticks calculated base on the point element draw at the same position (by time scale). |
Beta Was this translation helpful? Give feedback.
-
|
@ChiragMittal As I have written before, I think, to reach what you need, you must set a Pay attention that is working because I set the Using your sample, I changed the layer axis config as following: layer: {
display: true,
position: "top",
grid: {
drawOnChartArea: false
},
ticks: {
display: true,
color: "white",
maxTicksLimit: 9,
maxRotation: 0,
count(context) {
const chart = context.chart;
const meta = chart.getDatasetMeta(0);
return Math.min(meta._dataset.data.length, 8);
},
callback(value, index, ticks) {
const chart = chartRef.current;
if (!chart) {
return;
}
const meta = chart.getDatasetMeta(0);
if (index === 0) {
return meta._dataset.data[0].layer;
}
const amount = meta._dataset.data.length;
if (index === (ticks.length -1)) {
return meta._dataset.data[amount - 1].layer;
}
const gap = amount / (ticks.length - 1);
const dataIndex = Math.trunc(Math.min(amount - 1, gap * index));
return meta._dataset.data[dataIndex].layer;
}
},
min: Math.min(...layerArray),
max: Math.max(...layerArray),
type: "linear"
},You should add the useRef for chart: Let me know if it works in your app. EDIT: added callback to |
Beta Was this translation helpful? Give feedback.
-
|
It worked perfectly. Thank for ur help |
Beta Was this translation helpful? Give feedback.
@ChiragMittal As I have written before, I think, to reach what you need, you must set a
ticks.callbackin order to set a almost correct layer instead to leave the axis to show what it has calculated because the dataset is not related to layer axis.Pay attention that is working because I set the
countof ticks, in order to be sure that the space among ticks are always the same.There is also another point to underline: the callback is using some "_" properties.
It's not perfect and must be tested more in deep.
Using your sample, I changed the layer axis config as following: