-
|
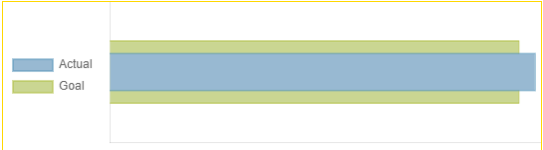
Hello, everyone. I followed the instructions for making a horizontal bar chart, then different instructions (YT video) on how to overlay one bar on top of another (see pic.) The issue is that if the cursor is within any bar, then what appears in the tooltip depends not on what bar is being hovered over, but whether the cursor is in the left half or right half of the bars area. Weird. Here is my code: Any thoughts on why this is happening are appreciated. Also, there is one vertical and one horizontal light grey line to the left and below the chart. Using 'grid' display: false didn't remove them. V/r, CFDev22 |
Beta Was this translation helpful? Give feedback.
Replies: 3 comments 5 replies
-
|
For hovering you can use tooltip mode index (this topic needs a video). https://www.chartjs.org/docs/3.8.0/samples/tooltip/interactions.html For scale borders are still showing. Gridlines removes only the lines excluding the x and y scale lines. |
Beta Was this translation helpful? Give feedback.
-
|
Hi, Udemology! Thank you for your advice. Unfortunately, it's not working. I don't know if it's the way I'm implementing ChartJS (copied code from CDN, saved to a .js file and am including it), or if I've found a bug of some sort. You know how when the cursor moves from one bar to another, the bar that the cursor is over is a little brighter as the bar the cursor was over gets a bit dimmer? This isn't happening. If the cursor is over either bar but is on the left side of the chart, the green bar gets brighter. If the cursor is over either bar on the right half of the chart, the blue bar gets brighter. I don't have a way of recording the action. Network security is too tight. Also, I tried your suggestion of
V/r, CFDev22 PS.. I moved the |
Beta Was this translation helpful? Give feedback.
-
|
The |
Beta Was this translation helpful? Give feedback.
-
|
Ah! Thank you, kurkle. That fixed that. V/r, CFDev22 |
Beta Was this translation helpful? Give feedback.
-
|
For the interaction, see: https://codepen.io/kurkle/pen/wvmqjpG |
Beta Was this translation helpful? Give feedback.
-
|
Sorry my mistake. Not paying attention by adding a 's' on the drawBorder. I have corrected it. Just incase anyone would read it. |
Beta Was this translation helpful? Give feedback.
-
|
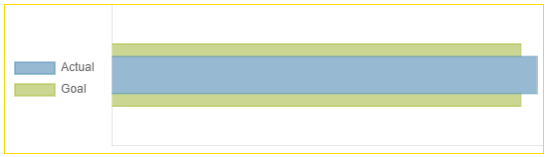
I fixed it. Didn't know what I was doing, but played around with it, and now it works as expected. I added interaction to the options. Here's all the relevant code. Thank you, Udemology and kurkle, for your help. V/r, CFDev22 |
Beta Was this translation helpful? Give feedback.
-
|
this worked for me interaction: {
axis: 'y',
}, |
Beta Was this translation helpful? Give feedback.
I fixed it. Didn't know what I was doing, but played around with it, and now it works as expected.
I added interaction to the options. Here's all the relevant code.