Display time elapsed since first data point #10230
-
|
Is there an easy way to display ticks' labels showing the time elapsed from the first data point instead of just formatting the tick date and time? Basically I want to show 0:00 on the first data point and then one tick every minute like: 1:00, 2:00… |
Beta Was this translation helpful? Give feedback.
Replies: 2 comments 5 replies
-
|
@Slion you should leverage on |
Beta Was this translation helpful? Give feedback.
-
|
Thanks, you made my day. I was already on that callback but was not sure how to deal with it exactly and was hoping there was some other way to get this done. Turns out that should do just fine. I also learned you can access the ticks actual value through that callback's ticks array. Your example also helped me sort out my dependencies, somehow I was using a mix of date-fns adapter and luxon lib, just don't ask me how that even worked. Now using all luxon lib and adapter as per your example. Great help! ⭐⭐⭐⭐⭐ |
Beta Was this translation helpful? Give feedback.
-
|
Actually I could not get it to work with date scale. I had to change it to linear scale and have something like: scales: {
x: {
type: 'linear',
title: {
display: false,
text: 'Date'
},
ticks: {
autoSkip: true,
// We don't want to rotate labels
maxRotation: 0,
minRotation: 0,
// We want one tick every minute, which is 60000 milliseconds
stepSize: 60000,
// See: https://codepen.io/stockinail/pen/WNXVjqg
callback: function (value, index, ticks) {
if (index > 0) {
const first = ticks[0].value;
const date = ticks[index].value;
// in minutes
const diff = (date - first) / 60000;
return Math.round(diff) + ':00';
}
return '0:00';
}
}
}
}With date scale you can't start with 0:00 as your axis origin unless your data set starts exactly at the minute I guess. |
Beta Was this translation helpful? Give feedback.
-
Not sure if I understood correctly but even if you use the linear scale, the starting point depends on the data of the dataset. |
Beta Was this translation helpful? Give feedback.
-
My issue with date scale is that the first tick is not on the first data point, it's on the first specified unit, in my case: minute. Now you will hardly notice that in the example you provided because your data set goes on for over three hours so it does look like 0:00 is on the first data point when it is in fact on the first minute. With a data set that lasts for a few minutes only it is very noticeable. That was my issue: LATER: However if I reduce your data set it seems 0:00 is always at the origin and not at the first minute, so I'm not sure what is causing this in my case. I ought to take a closer look at the configuration. Could be the fact that I have many points per minutes when you only have one… |
Beta Was this translation helpful? Give feedback.
-
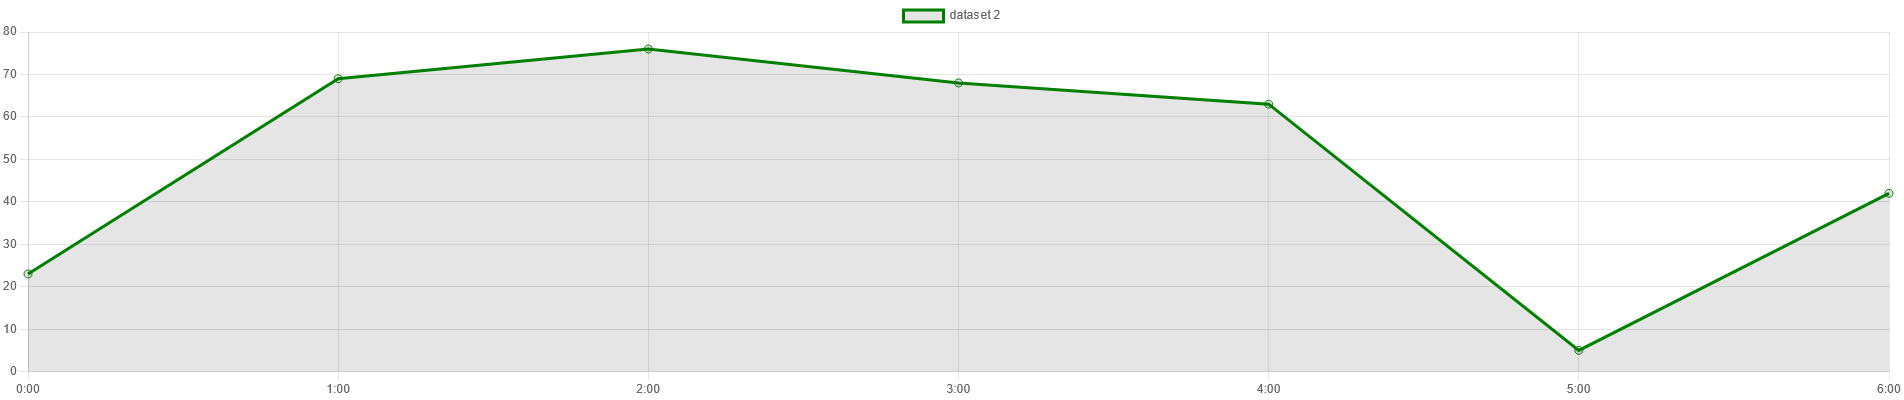
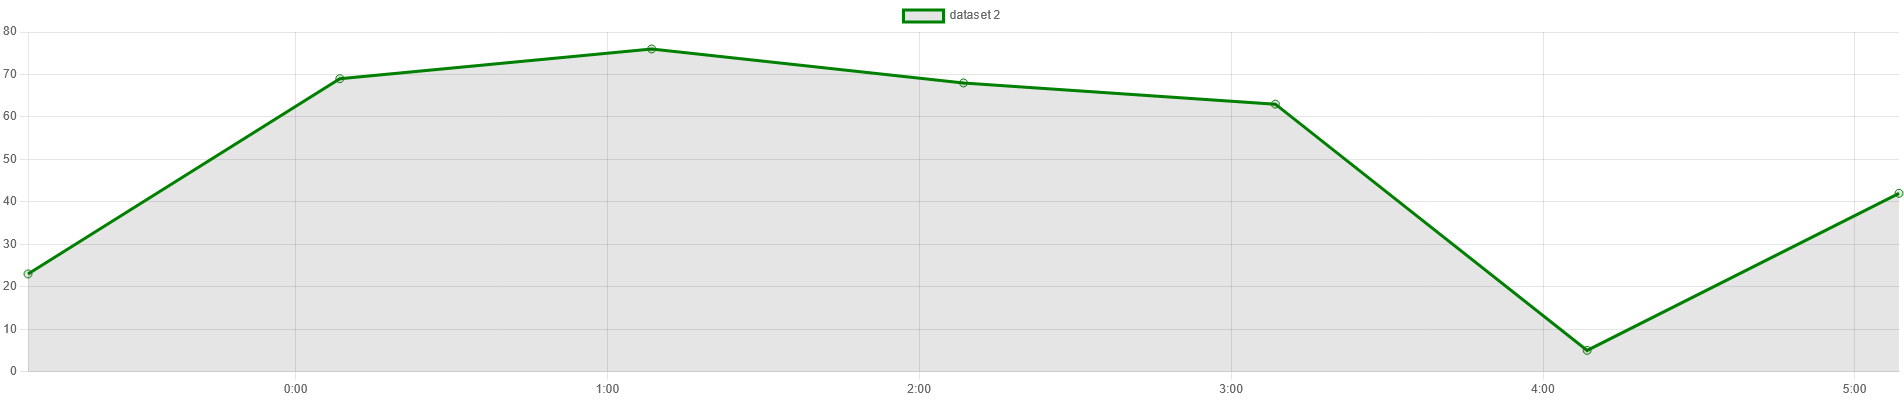
That's what I meant. I have cleaned up the sample in codepen, reducing the data and removing useless options (there were coming from another use case). I think, maybe I'm wrong, your case could be related to https://www.chartjs.org/docs/latest/axes/cartesian/time.html#ticks-source Without that options, the ticks are not located to the data value. Setting Ticks source = 'data'
Without ticks source (def = 'auto')
|
Beta Was this translation helpful? Give feedback.
-
|
I have changed the codepen a little bit : https://codepen.io/stockinail/pen/WNXVjqg The data are based on samples every 10 seconds. |
Beta Was this translation helpful? Give feedback.
@Slion you should leverage on
ticks.callbackon the scale. https://www.chartjs.org/docs/latest/axes/labelling.html#creating-custom-tick-formatsCodepen: https://codepen.io/stockinail/pen/WNXVjqg