Custom outer shadow on pie/doughnut charts #10115
-
|
Hello,
|
Beta Was this translation helpful? Give feedback.
Answered by
LeeLenaleee
Jan 31, 2022
Replies: 1 comment
-
|
Yes you could make a second dataset with the shadow colors and the same values as your original one and then use the const options = {
type: 'doughnut',
data: {
labels: ["Red", "Blue", "Yellow", "Green", "Purple", "Orange"],
datasets: [{
label: '# of Votes',
data: [12, 19, 3, 5, 2, 3],
backgroundColor: ["Red", "Blue", "Yellow", "Green", "Purple", "Orange"],
radius: 0
},
{
label: '# of Points',
data: [12, 19, 3, 5, 2, 3],
backgroundColor: ["Red", "Blue", "Yellow", "Green", "Purple", "Orange"]
}
]
},
options: {
onHover: (evt, activeEls, chart) => {
chart.getDatasetMeta(0).data.forEach(dp => {
dp.innerRadius = 0;
dp.outerRadius = 0;
});
if (activeEls.length === 0 || activeEls[0]?.datasetIndex === 0) {
return;
}
const hovered = activeEls[0];
const dpPointToEnlarge = chart.getDatasetMeta(0).data[hovered.index];
dpPointToEnlarge.innerRadius = hovered.element.outerRadius;
dpPointToEnlarge.outerRadius = hovered.element.outerRadius + (hovered.element.outerRadius - hovered.element.innerRadius) / 2;
}
}
}
const ctx = document.getElementById('chartJSContainer').getContext('2d');
new Chart(ctx, options); |
Beta Was this translation helpful? Give feedback.
0 replies
Answer selected by
alpercun
Sign up for free
to join this conversation on GitHub.
Already have an account?
Sign in to comment
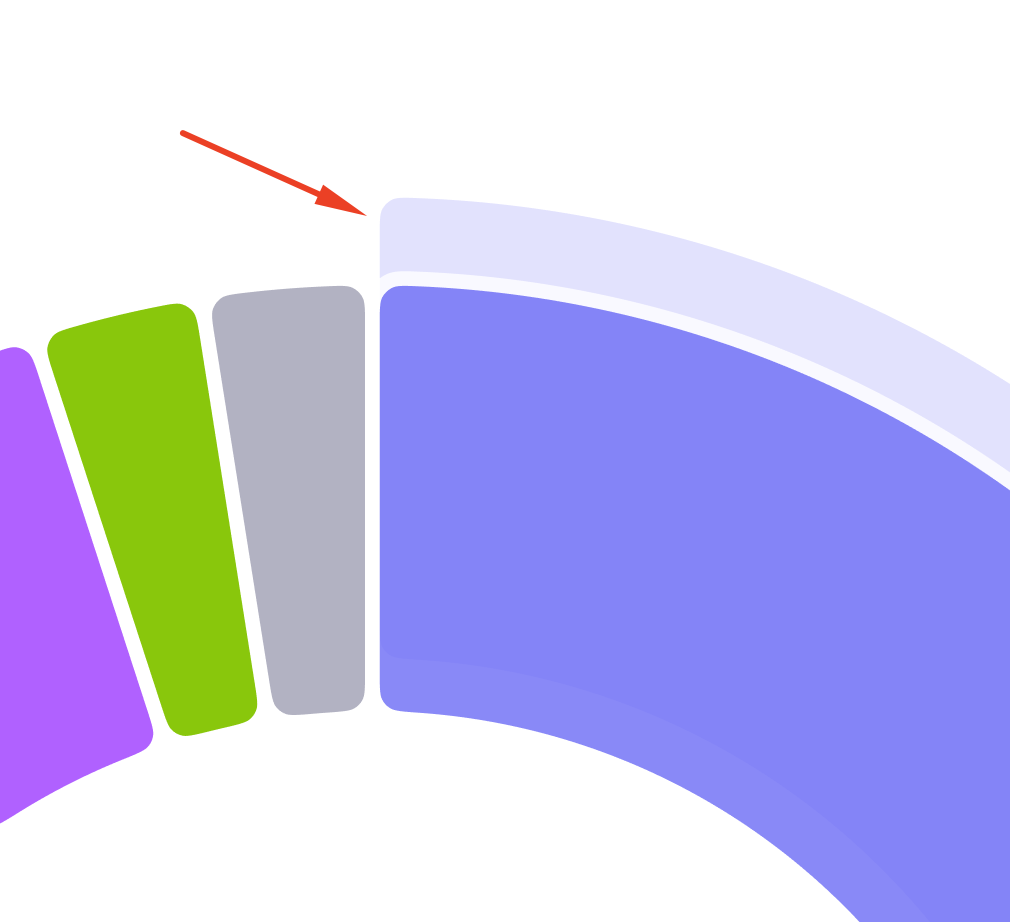
Yes you could make a second dataset with the shadow colors and the same values as your original one and then use the
onHoverconfig to make them appear or hide (note I used same colors but if you pass in lighter versions it will look more like a shadow):