-
|
Hi |
Beta Was this translation helpful? Give feedback.
Replies: 2 comments 1 reply
-
|
Yes this is possible, you can use extra datasets with object notation to fill those gaps, you can use line segments styling or you can make use of a line annotation from the annotation plugin |
Beta Was this translation helpful? Give feedback.
-
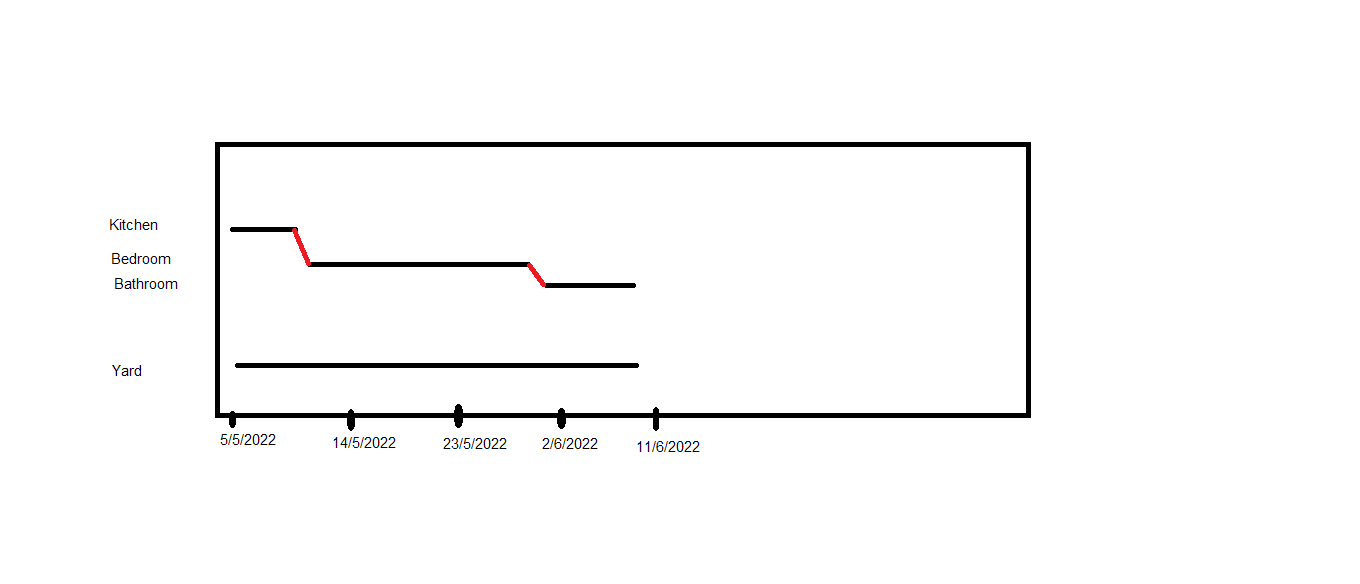
Hello again. Thanks for your feedback. here is the example i think is useful for me: https://www.chartjs.org/docs/latest/samples/line/stepped.html in my case i need the distance between days to show chart. The difference between mine case and this is in my case the dataset based on the days of chart (i mean in my case like i sent in photo i have some vertical data (kitchen and bathroom and etc) that the every one of them took some days to done) like it took 10 days to complete the kitchen and for example 3 days to complete the bathroom and then 5 days to complete bedroom. Like the image below Thanks in advance |
Beta Was this translation helpful? Give feedback.
-
|
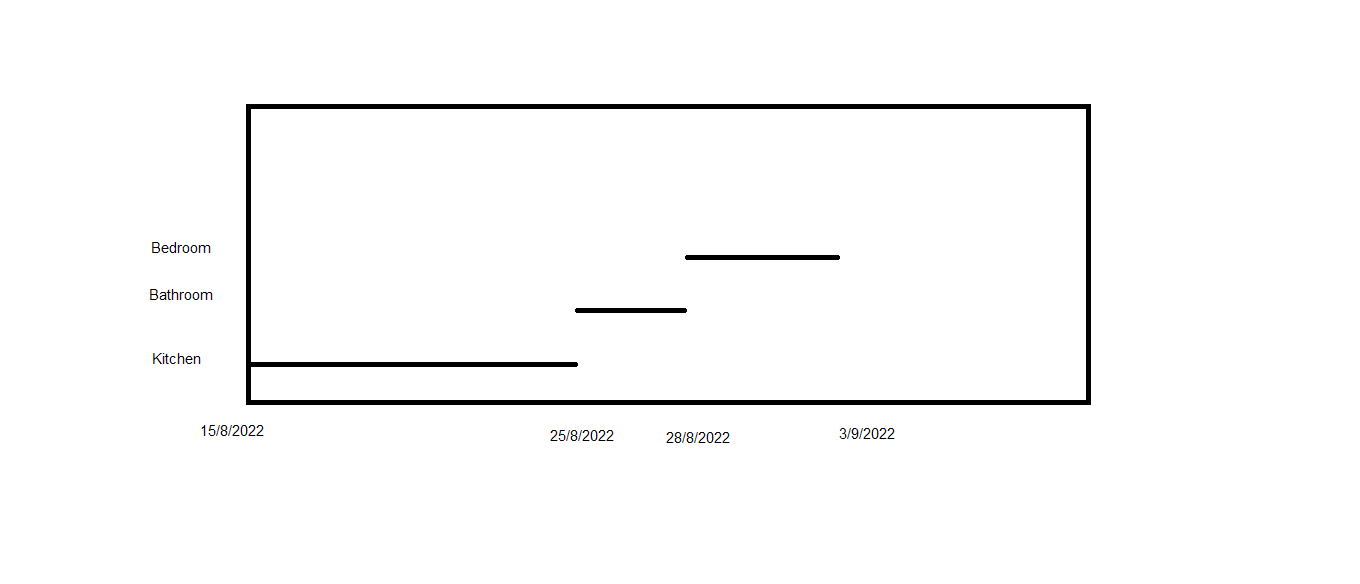
Hi Matinwd, Your picture looks more like a gantt chart instead of a line chart. If you need to have 'connecting lines' then you should use a line chart. But if I look at your new picture i looks like a gantt chart or floating bar chart. If you copy the JS code below you have a quick sample. Hope this helps. ` <script type="text/javascript" src="https://cdn.jsdelivr.net/npm/chart.js"></script> |
Beta Was this translation helpful? Give feedback.
Hi Matinwd,
Your picture looks more like a gantt chart instead of a line chart. If you need to have 'connecting lines' then you should use a line chart. But if I look at your new picture i looks like a gantt chart or floating bar chart.
There is whole video about gantt/floating bar chart here: https://youtu.be/0AUALgE0Lvg
If you copy the JS code below you have a quick sample. Hope this helps.
` <script type="text/javascript" src="https://cdn.jsdelivr.net/npm/chart.js"></script>
<script src="https://cdn.jsdelivr.net/npm/chartjs-adapter-date-fns/dist/chartjs-adapter-date-fns.bundle.min.js"></script>