-
|
I'm working on a little project where I am allowing a user to build a cycling workout, and the chartjs figure would essentially look like the following
these are built as intervals, so it would be something like 10min, 10min, 5min, 10min, etc. Is there a way to take those interval lengths and have them be the width of the data? or do I have to do something like interval 1 (0-10min) interval 2 (10-20mins)? Hope that makes sense and happy to provide a working example of what I'm doing if it'll help folks see what I'm doing |
Beta Was this translation helpful? Give feedback.
Replies: 1 comment
-
|
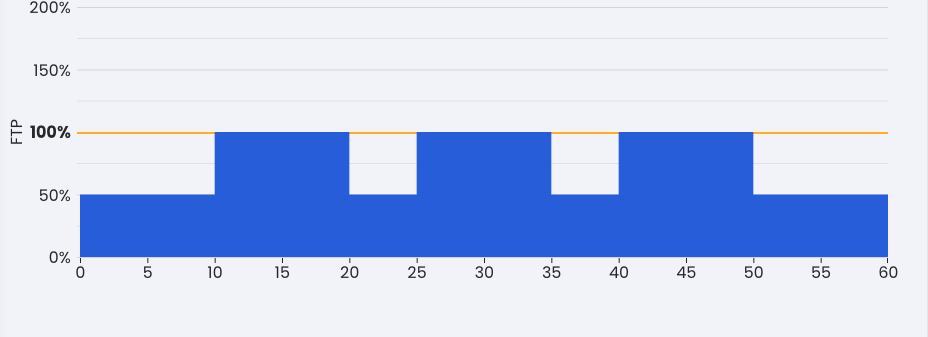
Answering my own question! Managed to work stuff out, essentially using a stepped line chart, and doing some math between the interval durations and the elapsed time I was able to plot this out. I also had to create a separate final value. If anyone is really interested I can post code, but this is the final outcome
|

Beta Was this translation helpful? Give feedback.
Answering my own question! Managed to work stuff out, essentially using a stepped line chart, and doing some math between the interval durations and the elapsed time I was able to plot this out. I also had to create a separate final value. If anyone is really interested I can post code, but this is the final outcome