-
|
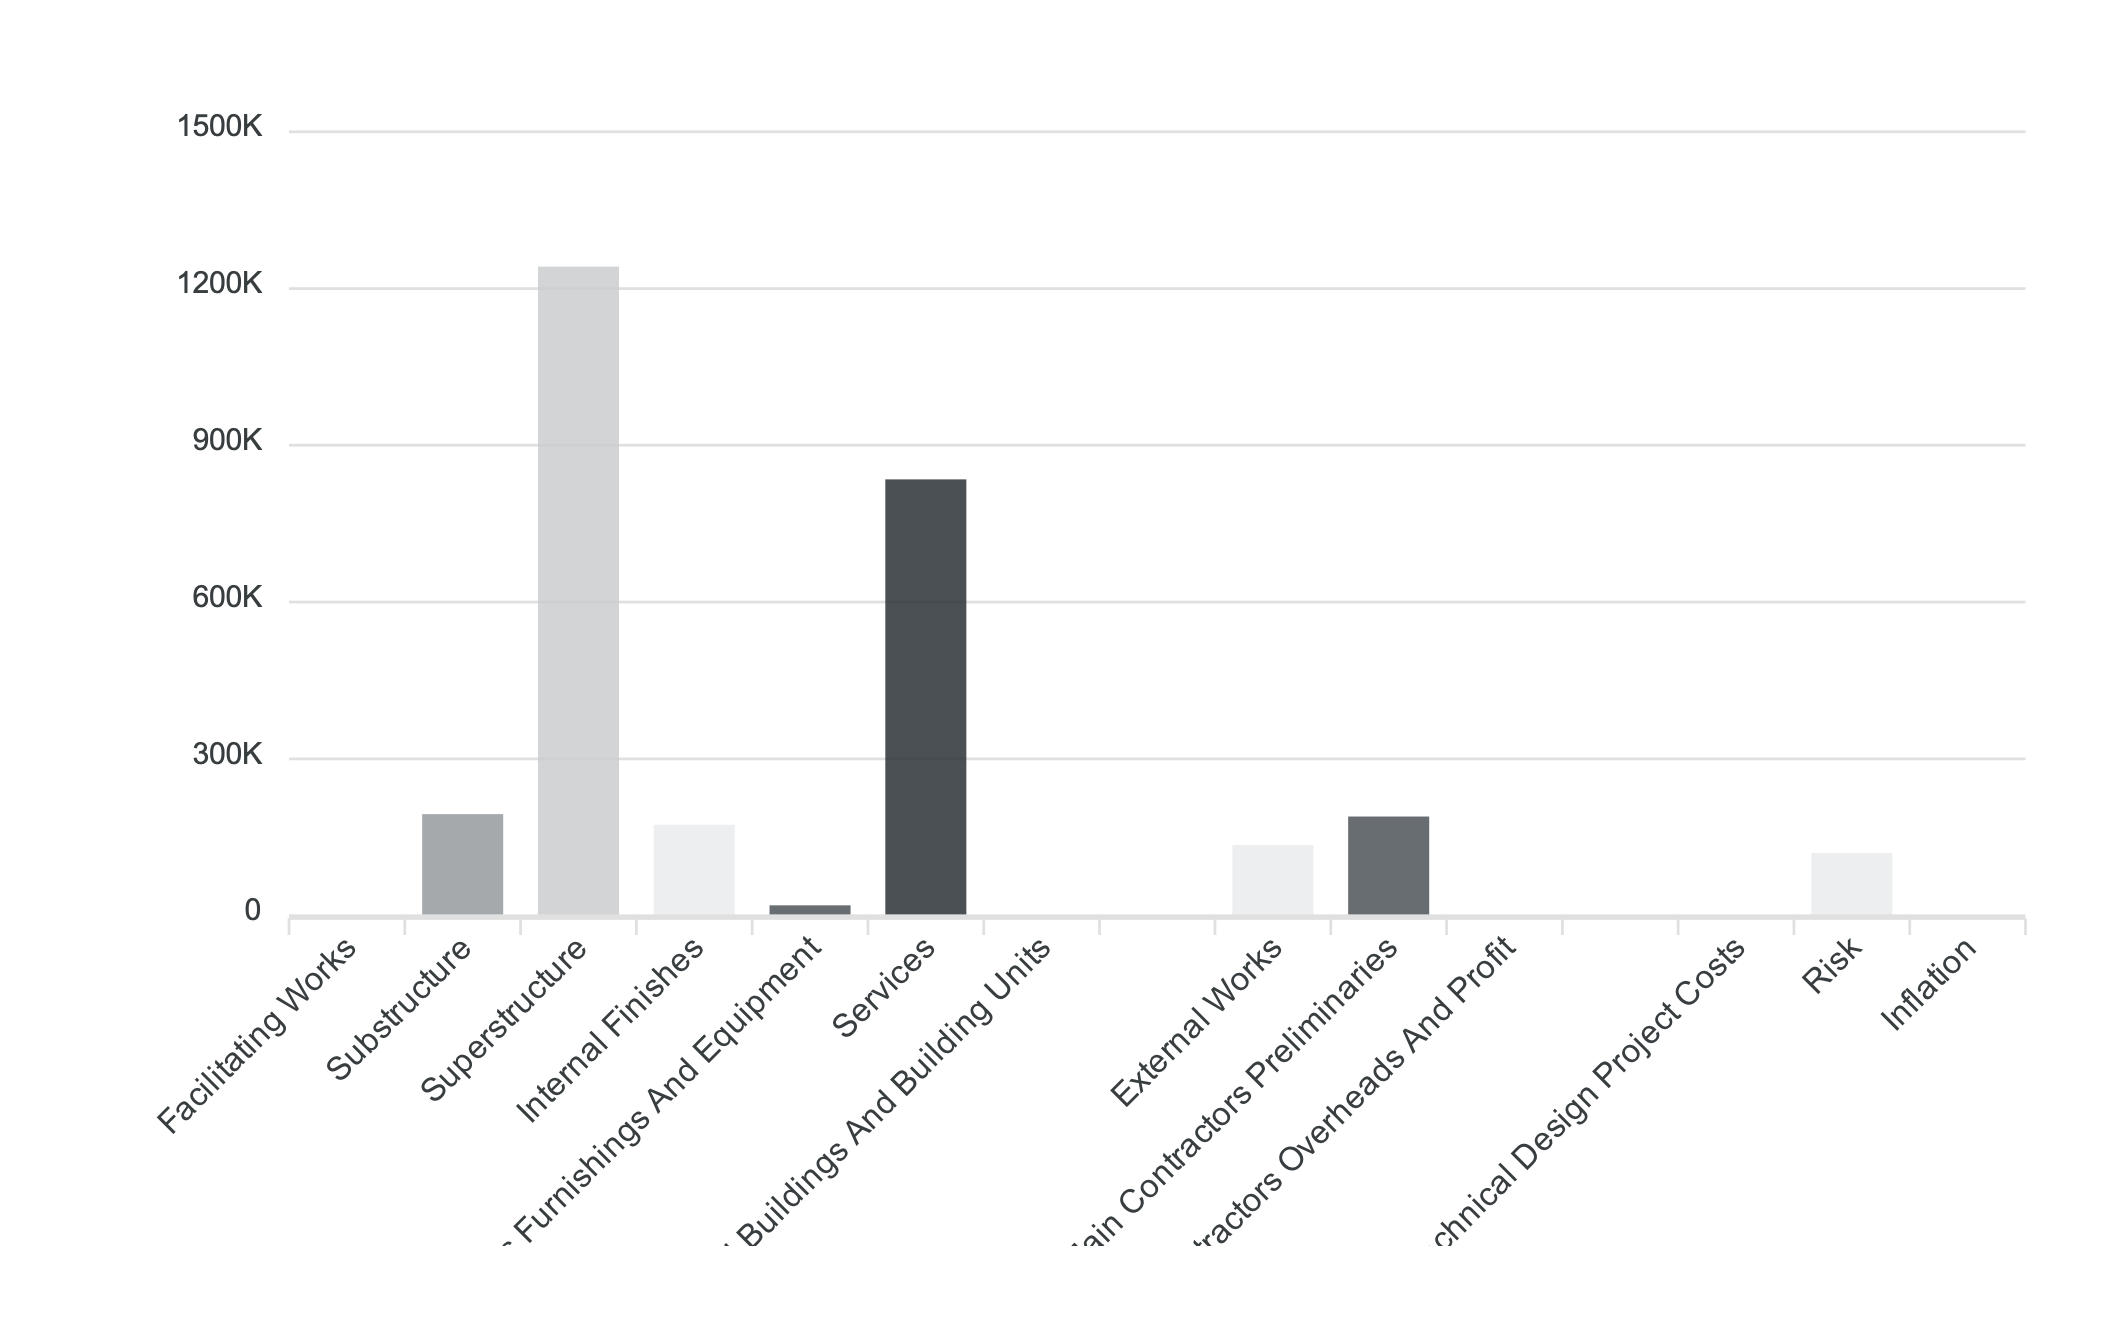
I have a graph, but the labels are long and they are being clipped:
It seems that the height is automatically calculated by the script, as when I try to make changes to the css in devtools as soon as change it, the chart refreshes itself and reverts back to its original values. Is there any way that I can either wrap the text or get it to allow more space for this? It's difficult for me to extract this as its pulled together inside javascript in Retool, then sent across to APITemplate.io which generates a PDF, but the code I have that sets this up is: <div id="chart"></div>
<script>
const data = [
{
"x": "Frame",
"y": 190000
},{
"x": "Stairs & Ramps",
"y": 150000
},{
"x": "Internal Walls & Partitions Partitions Partitions",
"y": 170000
},{
"x": "Facilitating Works",
"y": 30000
},{
"x": "Upper Floors",
"y": 460000
},{
"x": "External Walls",
"y": 155000
},{
"x": "Internal Doors",
"y": 130000
},{
"x": "Substructure",
"y": 160000
},{
"x": "Roof",
"y": 100000
},{
"x": "Windows & External Doors",
"y": 250000
},{
"x": "Internal Finishings",
"y": 45000
}
];
function coloriseData(data) {
let colors = ['#2A3138', '#969A9E', '#CACCCF', '#EAEBEC', '#4C535A'];
let coloredData = [...data]
.map((item, idx, arr) => ({
...item,
fillColor: colors[idx % colors.length]
}))
return coloredData;
}
// https://apexcharts.com/javascript-chart-demos/
new ApexCharts(document.querySelector("#chart"), {
chart: {
type: 'bar',
width: '100%',
animations: {
enabled: false,
},
toolbar: {
show: false
}
},
series: [{
name: 'Cost',
data: coloriseData(data)
}],
yaxis: {
labels: {
formatter: function(val) {
return val == 0 ? 0 : (val / 1000) + "K"
}
}
},
dataLabels: {
enabled: false
},
}).render();
</script>I've had a look through the discussions. The closest I can find is #2728 which is about clipping but doesn't seem to be quite the same. Please can anyone help me? It is the last part of this project and I am totally stuck! |
Beta Was this translation helpful? Give feedback.
Replies: 2 comments
-
|
FYI I have attempted to inject a if(x == "Fittings Furnishings And Equipment") {
x = "Fittings Furnishings\nAnd Equipment";
console.log(x);
}The br tag just gets escaped and echoed. The newline escape just gets ignored. I desperately just need to either be able to apply line wrapping, or give this section of the graph more height but just cannot seem to get access to it. |
Beta Was this translation helpful? Give feedback.
-
|
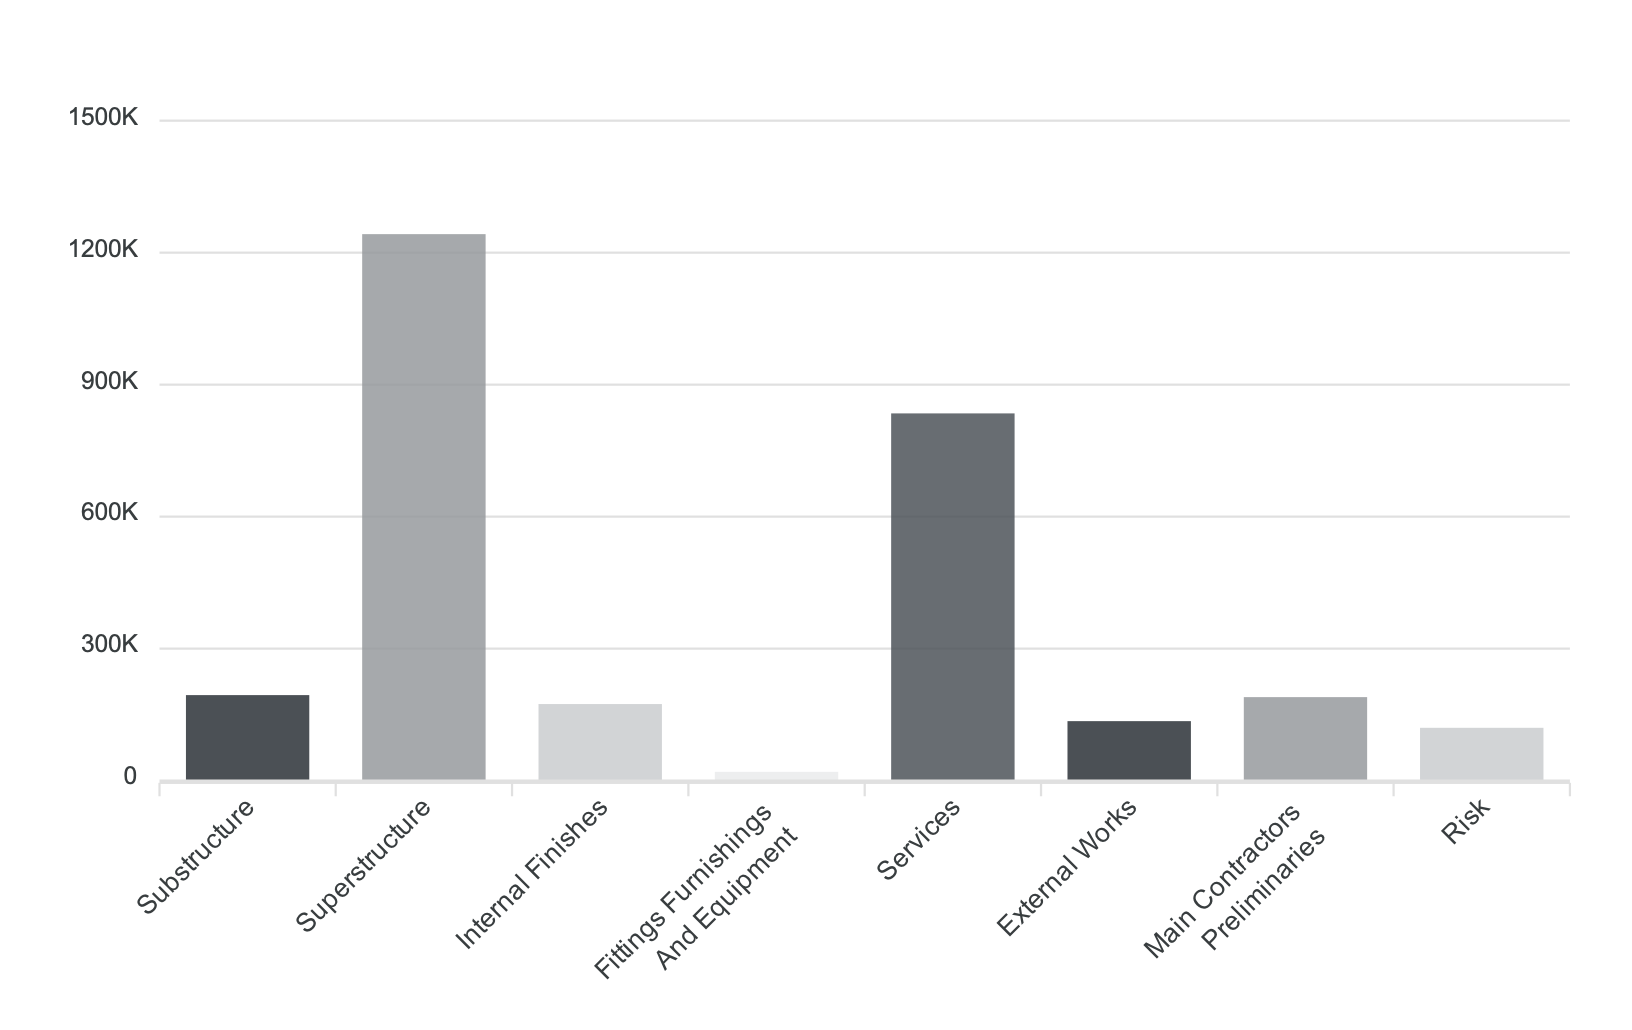
OK I found a solution for this one. You can put the label into an array and that splits it over multiple lines. I found the answer here: So, big thanks to @junedchhipa for posting this snippet! It's a messy special-case scenario now, but it works for what I need: switch(x) {
case "Fittings Furnishings And Equipment":
x = ["Fittings Furnishings", "And Equipment"];
break;
case "Prefabricated Buildings And Building Units":
x = ["Prefabricated Buildings", "And Building Units"];
break;
case "Main Contractors Preliminaries":
x = ["Main Contractors", "Preliminaries"];
break;
case "Main Contractors Overheads And Profit":
x = ["Main Contractors Overheads", "And Profit"];
break;
case "Other Technical Design Project Costs":
x = ["Other Technical Design", "Project Costs"];
break;
}
|
Beta Was this translation helpful? Give feedback.
OK I found a solution for this one. You can put the label into an array and that splits it over multiple lines.
I found the answer here:
#1683 (comment)
So, big thanks to @junedchhipa for posting this snippet!
It's a messy special-case scenario now, but it works for what I need: