what should I see? #6769
Replies: 4 comments 5 replies
-
|
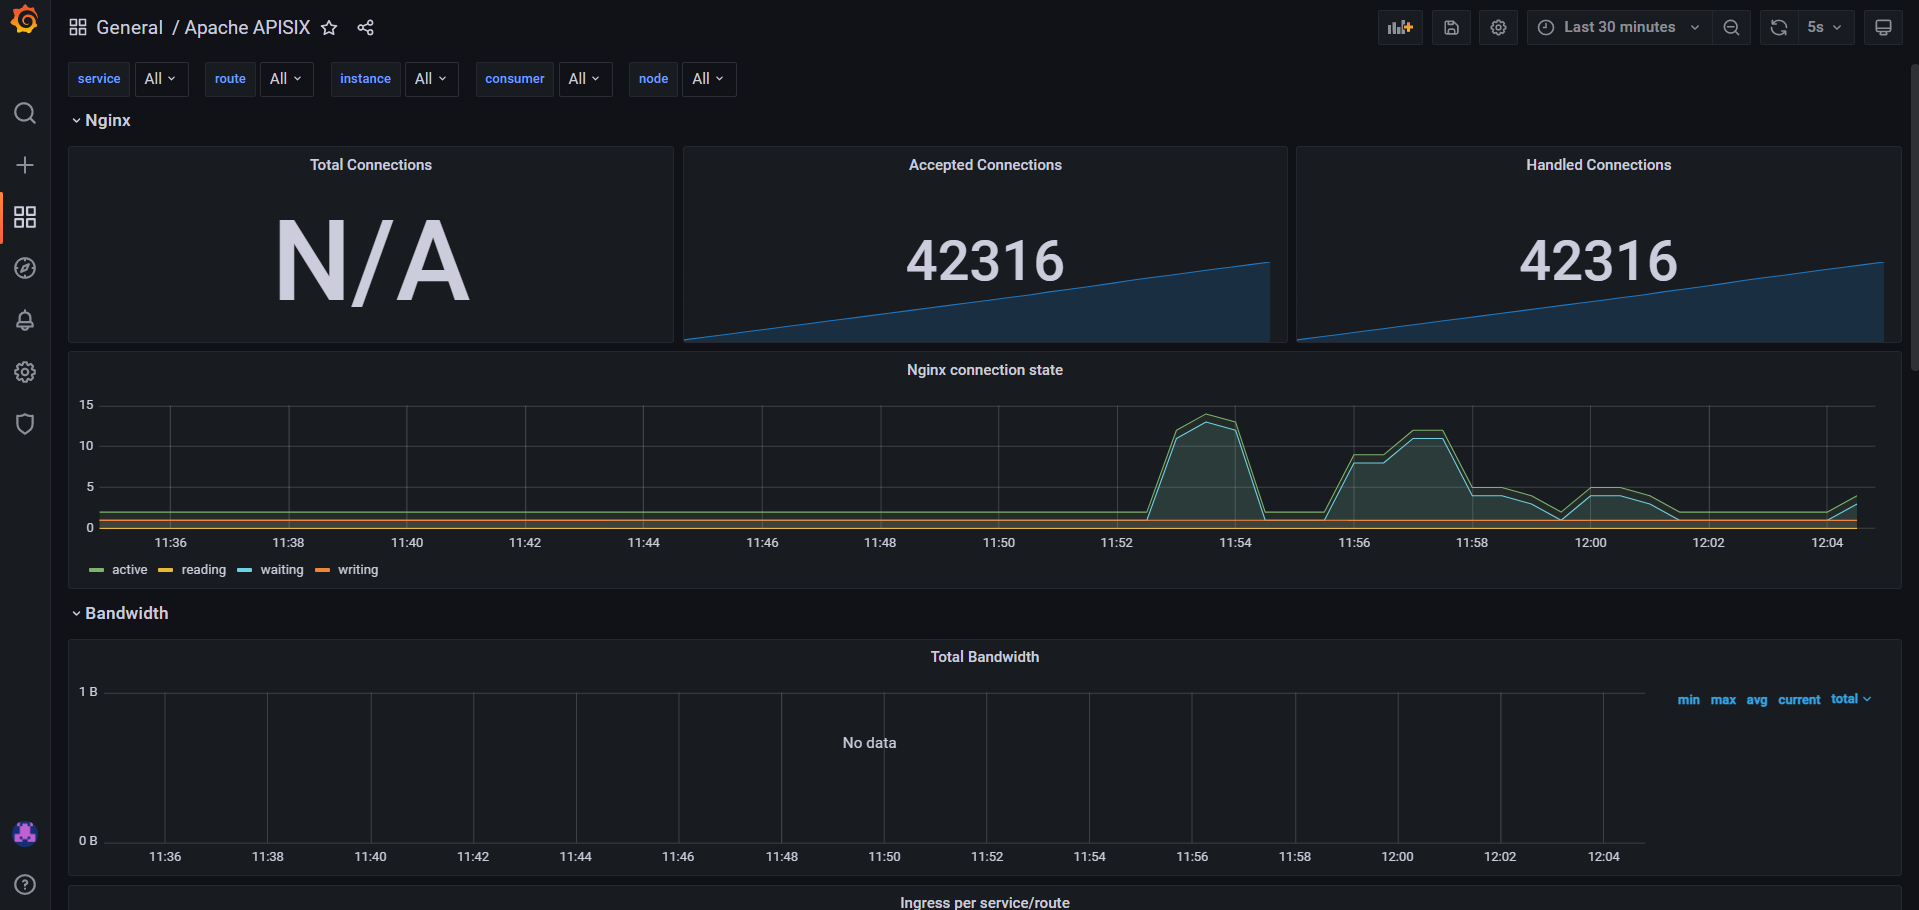
Can you see the monitoring information of Apache APISIX normally on the Grafana page? I think you can list your operation steps in detail, which is convenient for the community to troubleshoot problems. |
Beta Was this translation helpful? Give feedback.
-
|
no, why could I see there? I haven't loaded any dashboard for Apisix to Grafana. |
Beta Was this translation helpful? Give feedback.
-
|
I just added a dashboard to Grafana for Apisix; ...but apisix dashboard screen is still empty. |
Beta Was this translation helpful? Give feedback.
-
|
sorry, how can grafana dashboard be displayed there? Grafana access needs to be authentication and authorization. |
Beta Was this translation helpful? Give feedback.
-
|
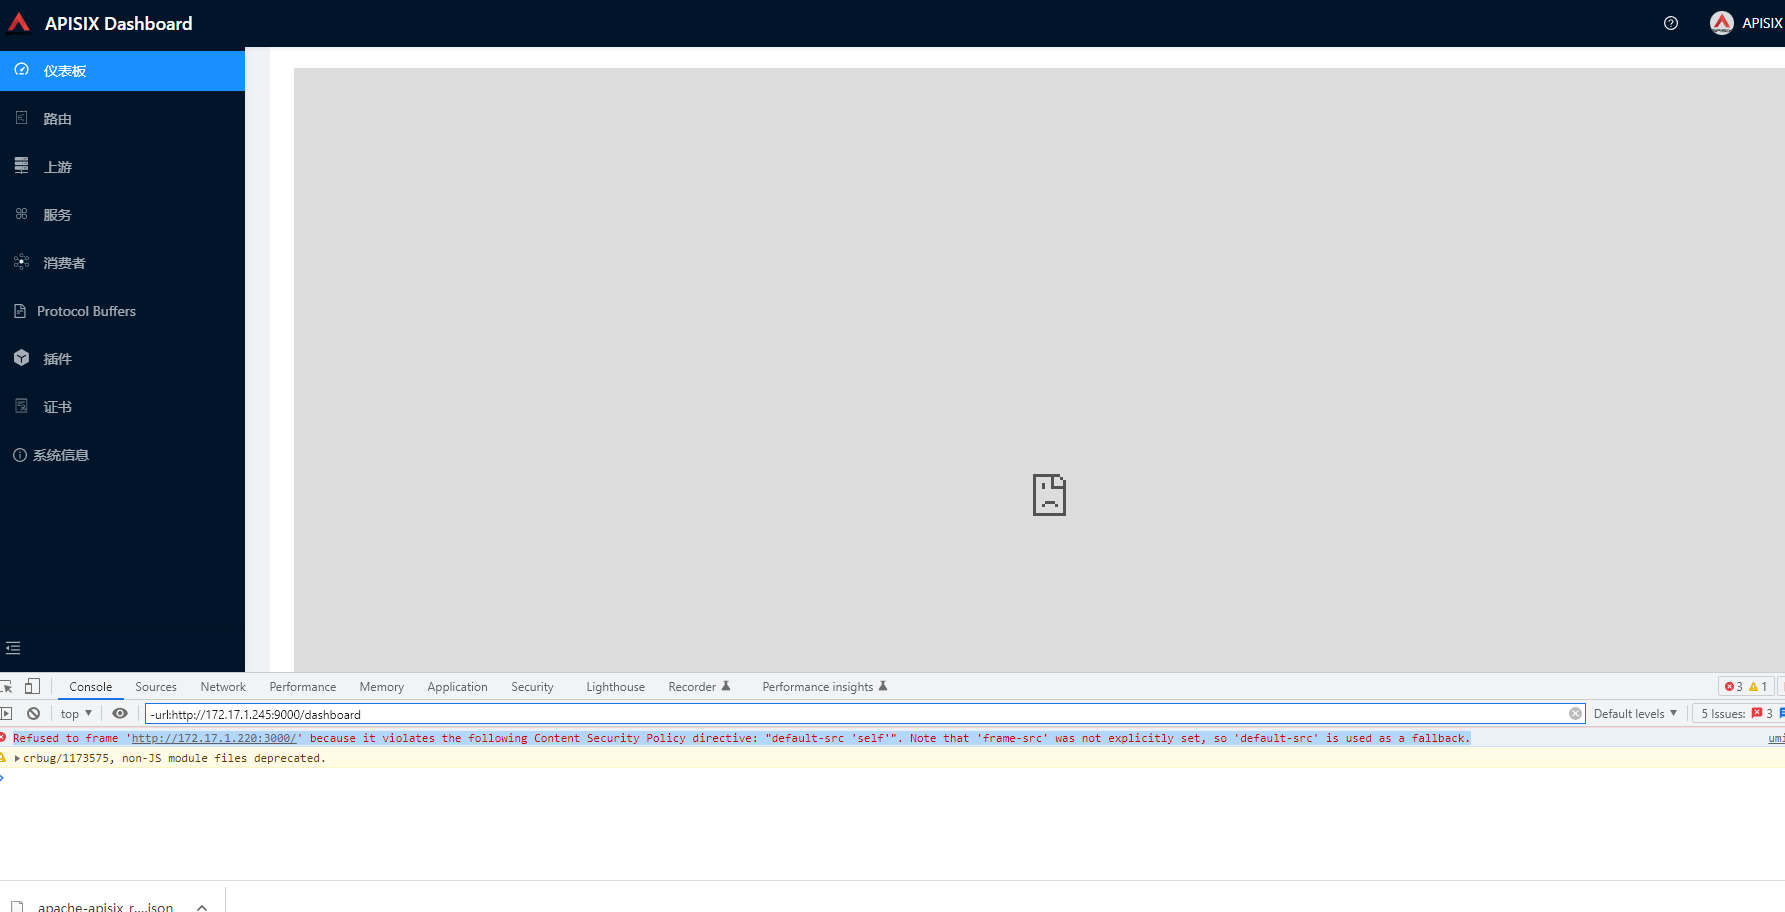
Hi @tirelibirefe, APISIX Dashboard supports the monitor page by referencing it in iframe. Before accessing Grafana, please Enable allow_embedding=true, which defaults to false. This causes the browser to fail to render Grafana pages properly due to security policies. |
Beta Was this translation helpful? Give feedback.
-
|
i have set allow_embedding = true and set but my page show
|
Beta Was this translation helpful? Give feedback.
-
I also get this issue. Any updates? |
Beta Was this translation helpful? Give feedback.
-
|
@LiberiFatali You can refer to this issue. apache/apisix-dashboard#2586 |
Beta Was this translation helpful? Give feedback.
-
|
Great, that works for me. Thanks! |
Beta Was this translation helpful? Give feedback.
Uh oh!
There was an error while loading. Please reload this page.
-
Hello,
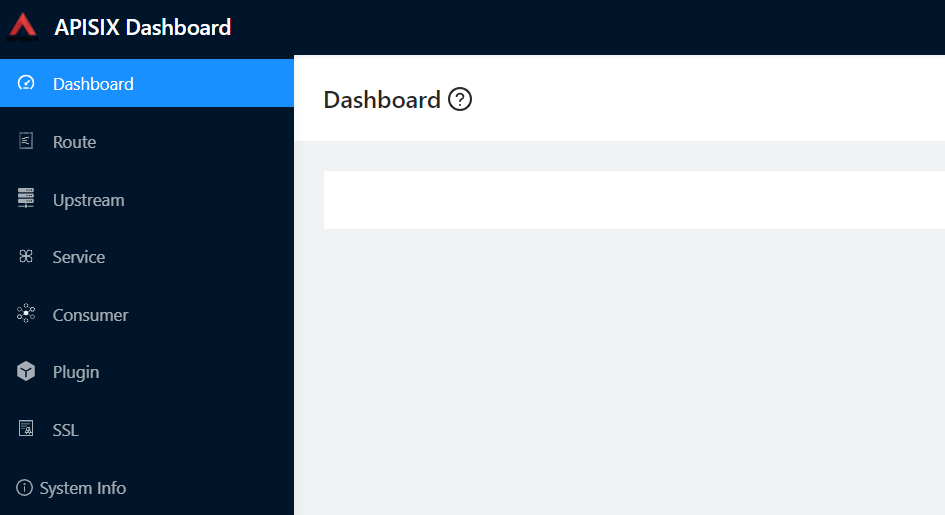
I've entered grafana url to apisix dashboard but the page is empty.
What should I see there?
Thanks
Beta Was this translation helpful? Give feedback.
All reactions