-
|
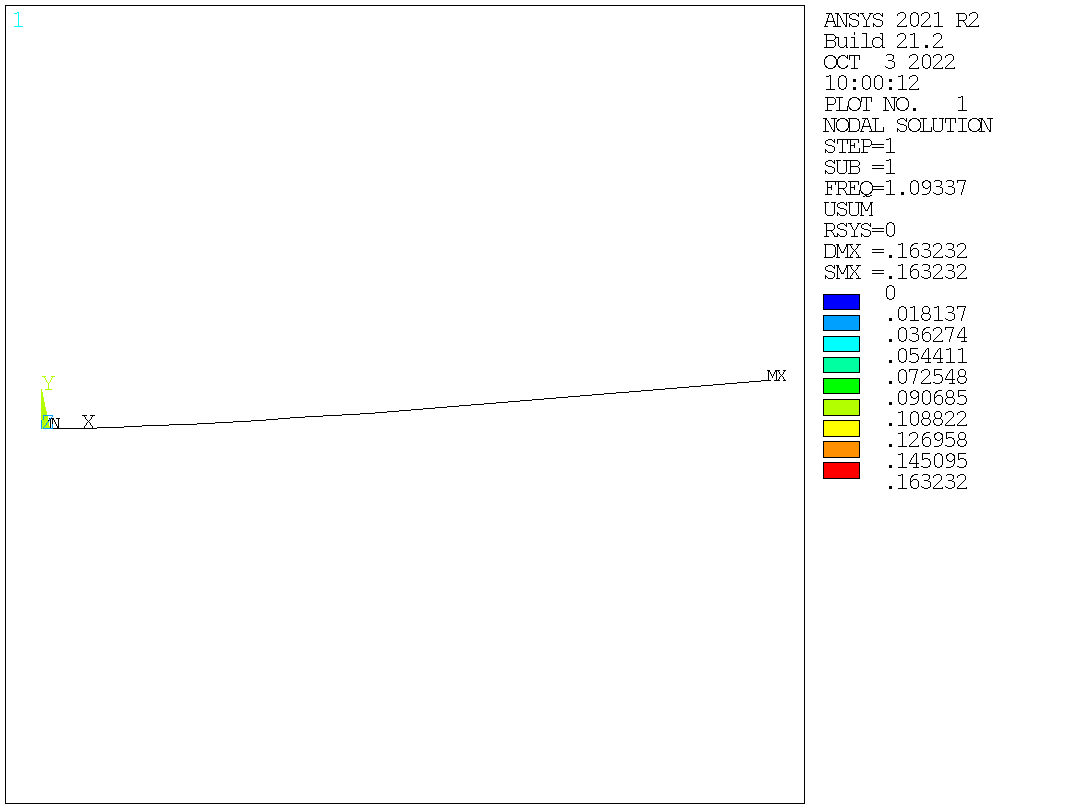
Hi, I am trying to plot modal deformed shapes, with colors to a png file. But I fail miserably... Below is a short example of what I am trying. I have two files, one in python, one is an apdl input. My best guess is that it is somehow connected to how apdl manage the plot in batch and I feel like I am missing a parameter somewhere. I think I already experienced that in pure apdl. If relevant, I work on a Windows setup. If I ask the plot through mapdl command, or through an input file, I get the mode shape, but my beam is all B&W. If I open a gui and relaunch my input file, it is working properly. Attached are the results. Does anyone would have an idea about this difficulty ? Thank you in advance, and sorry for my english... Alfred from pathlib import Path
from shutil import rmtree
import numpy as np
from ansys.mapdl.core import launch_mapdl
base_path = Path(__file__).parent
# Using a subfolder to store all APDL files
apdl_path = base_path / "APDL"
# Deleting old files
for path in apdl_path.glob("**/*"):
if path.is_file():
path.unlink()
elif path.is_dir():
rmtree(path)
apdl_path.mkdir(exist_ok=True)
mapdl = launch_mapdl(
run_location=apdl_path,
cleanup_on_exit=True,
jobname="z_1_modele",
log_apdl=apdl_path / "1_modele.apdl",
additional_switches="-smp",
)
mapdl.allow_ignore = True
mapdl.finish()
mapdl.clear()
mapdl.abbr("ESHAPE_0", "/ESH,0")
mapdl.abbr("ESHAPE_1", "/ESH,1")
mapdl.prep7()
mapdl.k(1, 0, 0, 0)
mapdl.k(2, 10, 0, 0)
mapdl.l(1, 2)
mapdl.et(1, "BEAM188")
mapdl.sectype(1, "BEAM", "HREC", refinekey=2, name="Carré")
mapdl.secdata(0.1, 0.1, 0.005, 0.005, 0.005, 0.005)
mapdl.mp("EX", 1, 200e9)
mapdl.mp("NUXY", 1, 0.3)
mapdl.mp("DENS", 1, 7900)
mapdl.mp("DMPR", 1, 0.03)
mapdl.esize(0.5)
mapdl.lmesh("ALL")
mapdl.dk(1, "ALL", 0)
solu = mapdl.modal_analysis(nmode=10, freqe=100, elcalc=True)
print(solu)
# Output full black beam
mapdl.post1()
mapdl.rgb("index", 100, 100, 100, 0)
mapdl.rgb("index", 0, 0, 0, 15)
mapdl.set(nset=1)
mapdl.show()
mapdl.plnsol("U", "SUM")
mapdl.view(1, 0, 0, 1)
mapdl.angle(1, 1)
mapdl.auto(1)
mapdl.show("PNG")
mapdl.gfile(800)
mapdl.replot()
mapdl.show("CLOSE")
# Output full black beam
mapdl.input(base_path / "extract_modes.apdl")
# Output colored beam if extract_modes.apdl is run interactively
# mapdl.open_gui(inplace=True)
mapdl.exit()
P.S. I also tried to plot with the specific pymadpl plot ressources, but I haven't been able to plot a deformed shape with a nodal displacement colorbar... |
Beta Was this translation helpful? Give feedback.
Replies: 3 comments 1 reply
-
|
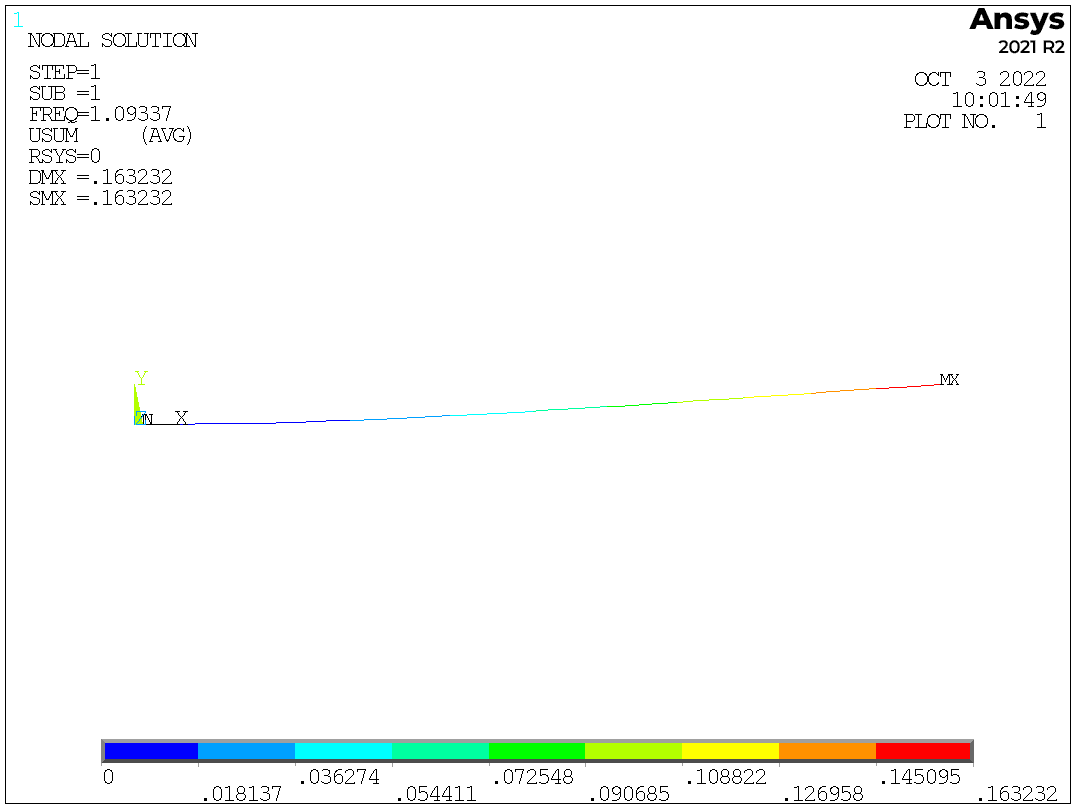
Hi @half1red Please see the MAPDL command help on /GRAPHICS. MAPDL as a Service runs like batch, so the default graphics is "Full" which only plots beam elements as lines. Also I see you abbreviated the /ESHAPE command but did not use it; will need to do so in order to see the beam cross-section. You can add these commands just before the mapdl.prep7() mapdl.graphics("power") When MAPDL is started in interactive mode (GUI on) Power Graphics is the default. Also the plot will probably look like a thicker black line given the aspect ratio of the beam and zoomed out to see the whole thing. You'll probably need to zoom in some to better see the cross section. mike |
Beta Was this translation helpful? Give feedback.
-
|
Hi @half1red The PyMAPDL native plotting does not yet have a "scale factor" to apply to result plots. We can use the APDL command UPCOORD to do this. The displacements were pretty small for the second mode so I scaled it 2x to better see the deformed shape: mapdl.post1()
mapdl.rgb("index", 100, 100, 100, 0)
mapdl.rgb("index", 0, 0, 0, 15)
mapdl.set(nset=2)
mapdl.upcoord(2)
mapdl.post_processing.plot_nodal_displacement("norm", cpos="xy")Mike |
Beta Was this translation helpful? Give feedback.
-
|
Indeed, this is requested feature which eventually will come ... soon. |
Beta Was this translation helpful? Give feedback.
-
|
Thank you very much @mikerife . The mapdl.graphics("power") did the job, and the upcoord is a nice info to have also ! |
Beta Was this translation helpful? Give feedback.
Hi @half1red Please see the MAPDL command help on /GRAPHICS. MAPDL as a Service runs like batch, so the default graphics is "Full" which only plots beam elements as lines. Also I see you abbreviated the /ESHAPE command but did not use it; will need to do so in order to see the beam cross-section. You can add these commands just before the mapdl.prep7()
mapdl.graphics("power")
mapdl.eshape(1)
When MAPDL is started in interactive mode (GUI on) Power Graphics is the default.
Also the plot will probably look like a thicker black line given the aspect ratio of the beam and zoomed out to see the whole thing. You'll probably need to zoom in some to better see the cross section.
mike