Create interactive maps with Datawrapper
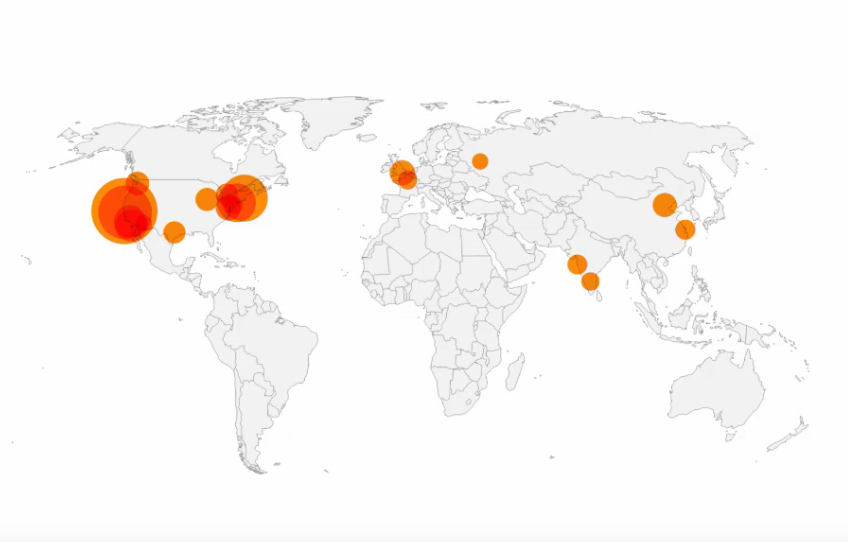
Symbol maps show symbols sized and colored according to your data. They work great for data for specific locations (like cities).
https://www.youtube.com/watch?v=4Ewat7ojICk
https://academy.datawrapper.de/article/114-how-to-create-a-symbol-map-in-datawrapper
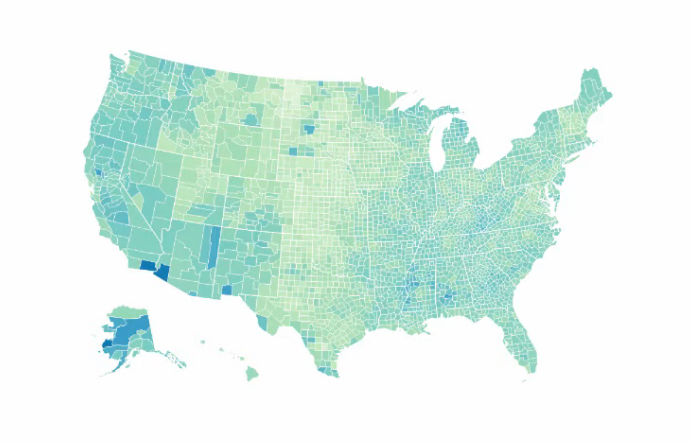
Choropleth maps color regions according to values in your dataset. They're great to show clear regional patterns.
https://www.youtube.com/watch?v=kw_mfPtCDtI https://academy.datawrapper.de/article/115-how-to-import-data-choropleth-map
Locator maps are great to show where something is located or happened, e.g. events within a city. These responsive maps are perfect for putting the places you mention in a story in context. Simply set markers, style them and define a text.
https://academy.datawrapper.de/article/161-how-to-create-a-locator-map