slow Actual value of Total Energy with real SolarEdge power increase/decrease #21
-
|
After installing the modbus plugin I noticed it works quite well: total values of a day/month match the values of the SolarEdge API and the Solar Edge portal. An example: it is cloudy and the SolarEdge Actual Value is 1330 Watt. However when the sun starts shining again my smart meter increases the Actual Return immediately to 2688 Watt (monitoring every second), which results in an increase of about 30 Watts per 5 seconds for the SolarEdge Actual Value to a value of 1880 Watt after let say 2 minutes . Then the clouds appear again and my Actual Return drops to 788 Watt, and the SolarEdge Actual Value will decrease over time. I also have an extra pulse meter connected to the SolarEdge Inverter. If Domoticz reads out this meter the Actual Energy value will increase/decrease immediately when the solar production increases/decreases in line with my smart meter Actual Return increases/decrease. I see this behavior during appearing/disappearing clouds but also when, occasionally, the inverter goes into throttle mode during the day and starts producing again with a substantial power increase. Then also the SolarEdge Actual Value ramps up slowly. It looks like this SolarEdge Actual Value behaves as a calculated value with a sort of moving average component. My question: is this latency a known issue, is it plugin/domoticz oriented ? Thanks! |
Beta Was this translation helpful? Give feedback.
Replies: 1 comment 1 reply
-
|
The plugin collects the data from the inverter at specific intervals.
The minimal interval is 5 seconds and that is therefore the minimum latency you will experience.
Most graphs generated by Domoticz show the last value updated in a 5 minute cycle. Does that explain what you are seeing? |
Beta Was this translation helpful? Give feedback.
-
|
Yes indeed this explains the behavior exactly. Thank you very much for answering my question! |
Beta Was this translation helpful? Give feedback.
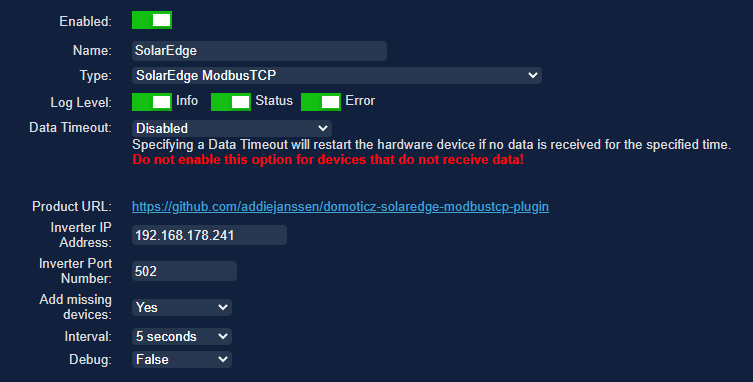
The plugin collects the data from the inverter at specific intervals.
That interval can be configured in the Setup -> Hardware section of Domoticz:
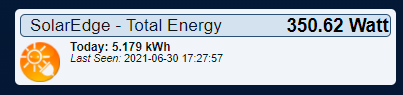
The minimal interval is 5 seconds and that is therefore the minimum latency you will experience.
This is also the interval at which the bold figure (350.62 Watt) in the dashboard will get updated:
Most graphs generated by Domoticz show the last value updated in a 5 minute cycle.
To prevent that the graphs show the latest value only, we average all the values over that 5 minute cycle.
Does that explain what you are seeing?