-
|
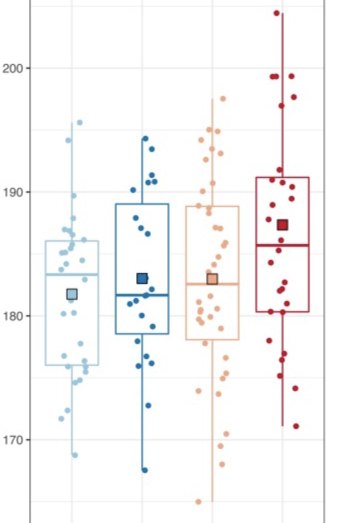
I am wanting to graph general characteristics of gene expression in several libraries (snippet below) Something as simple as stacked bar that bins expression values, violin plot, etc. for example below I am lookin for something with data plots (one for each library)
maybe like |
Beta Was this translation helpful? Give feedback.
Replies: 1 comment 3 replies
-
|
I have a feeling need to change to data frame were I have a column for |
Beta Was this translation helpful? Give feedback.
-
|
You might be able to use this as a guide/reference? It would be boxplot/library. |
Beta Was this translation helpful? Give feedback.
-
|
Thanks - that looks great! |
Beta Was this translation helpful? Give feedback.
-
It should! You wrote it! 😄 |
Beta Was this translation helpful? Give feedback.
I have a feeling need to change to data frame were I have a column for
Library