Glances CPU widgets not showing correct percentage (kind of) #675
-
|
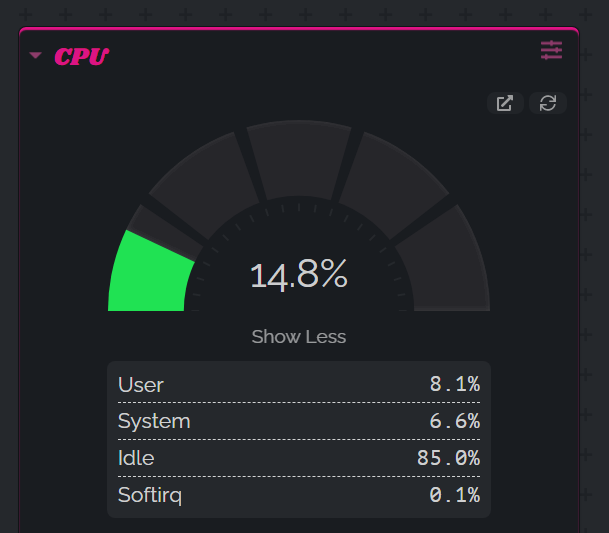
I've added the Glances CPU speedometer and history widgets to my dashboard. I noticed the percentage wasn't matching what was happening during a heavy processing time when reindexing photos on photoprism. It looks like these widgets only factor in user and system percentages, and leaves out others from Glances (iowait, irq, nice, etc.) In this example, my IOWAIT % was 67% of the CPU usage, so it wasn't factored in. For the speedometer, would it be easier to take 100% minus idle %? For the historical, maybe have the option to combine all cpu usage types to have a total cpu usage? And I still LOVE this application. This makes self-hosting so much easier to keep up with. THANKS! |
Beta Was this translation helpful? Give feedback.
Replies: 3 comments 3 replies
-
|
Hey @brpeterso Sorry about that, I just checked the code and it looks like you're right - the history chart ( I think your suggestion of using 100% - idle, for each core and averaging it out sounds like it would work, I'll try it out now :) The CPU widget was one of the harder ones to build, since:
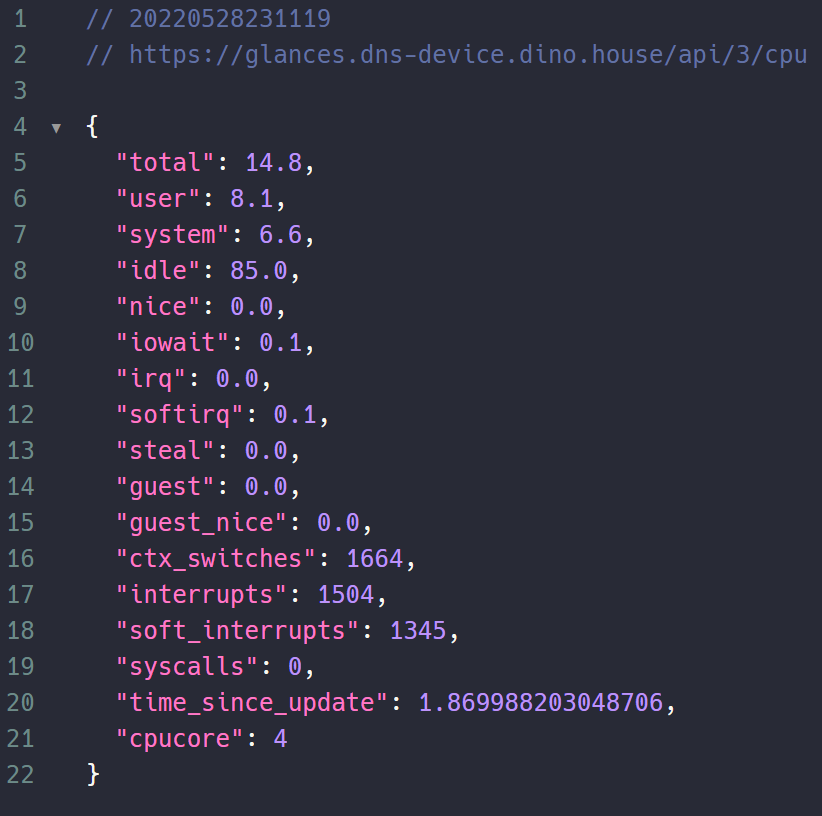
For reference, you can see what data is being returned with the Glances |
Beta Was this translation helpful? Give feedback.
-
|
I figured when mentioning the CPU categories there could be many and it might be a pain to factor them all in, especially with different systems. I look forward to the update. Keep up the great work! |
Beta Was this translation helpful? Give feedback.
-
|
I was looking into this this evening, and it turns out that the Gauge is actually using total for it's value. But I noticed that the Glance's web UI (and REST API) at least on my system, seemed to be about 5 seconds behind compared to HTOP. And then (depending on your update interval), Dashy's UI is an extra couple of seconds behind. Could the mis-match in values be caused by the time delay? If not, do you see correct data in Glance's UI? |
Beta Was this translation helpful? Give feedback.
-
|
I thought the delay was initially impacting the reporting, but I noticed
the CPU history wasn't going over ~35% while unRAID was reporting greater
than 90% when running the photoprism indexing. I then looked at glances
and saw most of the cpu% was in the iowait category. I can attempt to do
this again and provide a screenshot between the three if that helps.
…On Sat, May 28, 2022 at 5:14 PM Alicia Sykes ***@***.***> wrote:
I was looking into this this evening, and it turns out that the Gauge is
actually using total
<https://github.com/Lissy93/dashy/blob/master/src/components/Widgets/GlCpuGauge.vue#L45>
for it's value. But I noticed that the Glance's web UI (and REST API) at
least on my system, seemed to be about 5 seconds behind compared to HTOP.
And then (depending on your update interval), Dashy's UI is an extra couple
of seconds behind. Could the mis-match in values be caused by the time
delay? If not, do you see correct data in Glance's UI?
—
Reply to this email directly, view it on GitHub
<#675 (reply in thread)>,
or unsubscribe
<https://github.com/notifications/unsubscribe-auth/AF333XNYNAJ6CW6YEXN3CGDVMKEDFANCNFSM5W5D2JOQ>
.
You are receiving this because you were mentioned.Message ID:
***@***.***>
|
Beta Was this translation helpful? Give feedback.
-
|
So I think that Glances does include IO Wait within the total CPU usage, so that shouldn't be the reason. Under the hood, Glances uses psutil, which seems to behave differently on different system architectures, and there's actually a bunch of open issues on it's repo about CPU frequency inconsistencies, which could lead the inaccurate info on Glances, which is then propagated onto Dashy. But I've spend the past hour trying to recreate on various systems, and with no luck. There is a delay varying from 0.8 to 4 seconds from actual system data. But the results I see on Dashy, do seem to align with Glances UI
|
Beta Was this translation helpful? Give feedback.
-
|
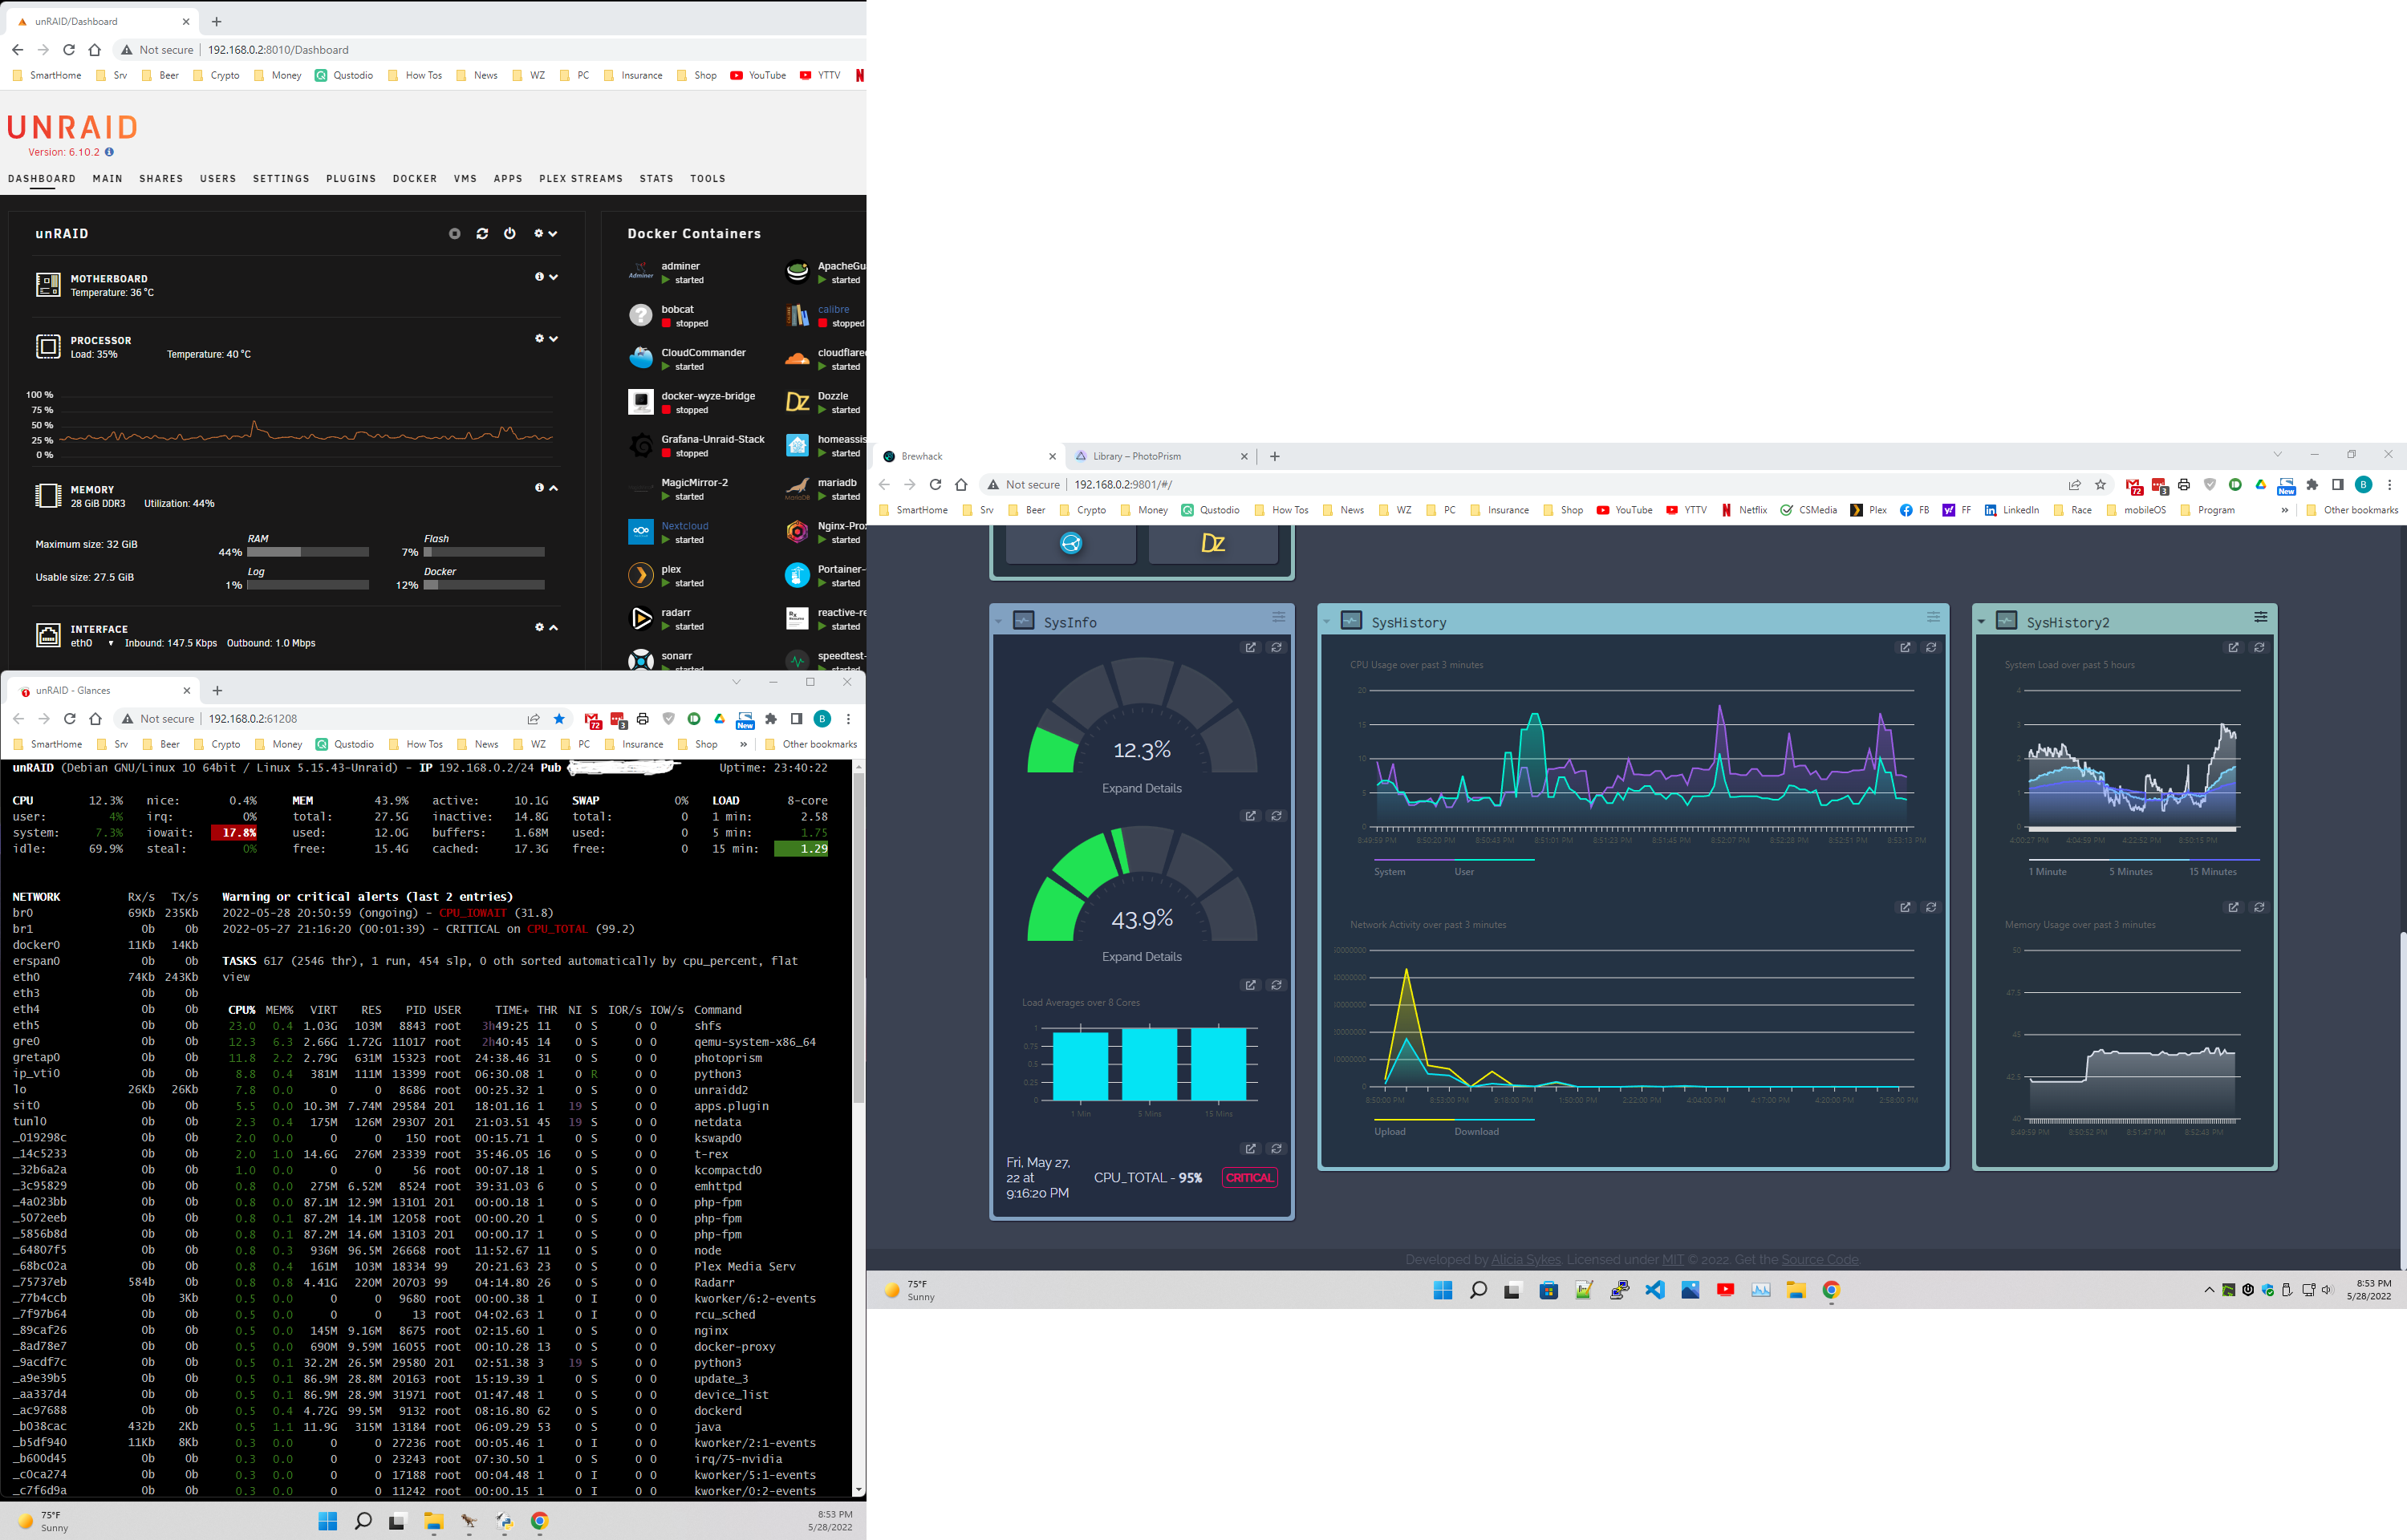
You're absolutely right. It looks like Glances shows the incorrect total
CPU%. I guess I was just looking at the idle%. I attached a screenshot of
Glances, Glances widget w/ Dashy, and my unRaid server. You see that
unRaid is running around 35% cpu usage, but Glances and the widget show
12.3% cpu usage. Interesting though the idle% on Glances looks correct, so
I still wonder if the 100 - Idle% would work. But in the end, your widget
is showing exactly what Glances is showing. Thanks for looking into this
further...I may try the Netdata widget to see how that looks.
…On Sat, May 28, 2022 at 6:33 PM Alicia Sykes ***@***.***> wrote:
So *I think* that Glances does include IO Wait within the total CPU
usage, so that shouldn't be the reason.
Under the hood, Glances uses psutil <https://github.com/giampaolo/psutil>,
which seems to behave differently on different system architectures, and
there's actually a bunch of open issues
<https://github.com/giampaolo/psutil/issues?q=is%3Aissue+is%3Aopen+cpu>
on it's repo about CPU frequency inconsistencies, which could lead the
inaccurate info on Glances, which is then propagated onto Dashy.
But I've spend the past hour trying to recreate on various systems, and
with no luck. There is a delay varying from 0.8 to 4 seconds from actual
system data. But the results I see on Dashy, do seem to align with Glances
UI
<https://user-images.githubusercontent.com/1862727/170844369-39747ec0-b7ff-4ac6-a56b-46178b0b816d.png>
<https://user-images.githubusercontent.com/1862727/170844687-f71638b1-fe66-4d63-b5c2-2ff32a130513.png>
—
Reply to this email directly, view it on GitHub
<#675 (reply in thread)>,
or unsubscribe
<https://github.com/notifications/unsubscribe-auth/AF333XJBDRJ7ZXLZ3PIECJ3VMKNJXANCNFSM5W5D2JOQ>
.
You are receiving this because you were mentioned.Message ID:
***@***.***>
|
Beta Was this translation helpful? Give feedback.
Hey @brpeterso
Sorry about that, I just checked the code and it looks like you're right - the history chart (
GlCpuHistory.vue) is only usingsystemanduserdata points. And for the gauge / speedometer (GlCpuGauge.vue), it's omitting several fields.I think your suggestion of using 100% - idle, for each core and averaging it out sounds like it would work, I'll try it out now :)
The CPU widget was one of the harder ones to build, since: