Visualization of chloroplast genome band age #157
-
|
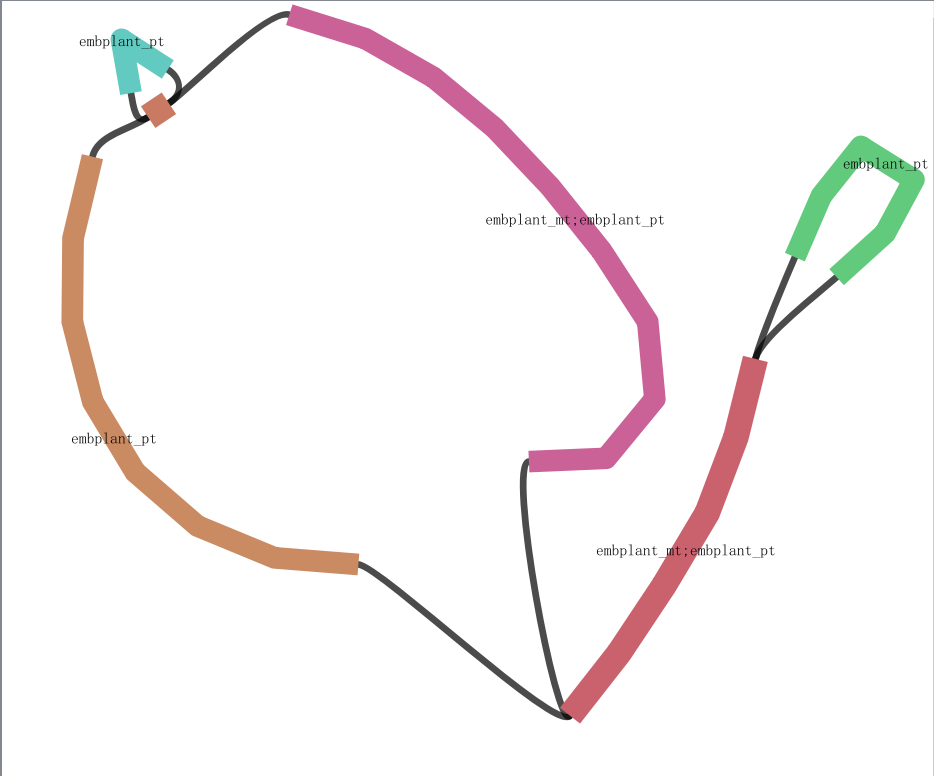
I used getorganelle to assemble the chloroplast genome. The visualization results using bandage are as follows. There seems to be a problem with the large single copy region. I hope to get the teacher's help! GetOrganelle v1.7.5.3 get_organelle_from_reads.py assembles organelle genomes from genome skimming data. Python 3.6.12 | packaged by conda-forge | (default, Dec 9 2020, 00:36:02) [GCC 9.3.0] 2022-03-24 22:41:22,984 - INFO: Pre-reading fastq ... 2022-03-24 22:46:14,459 - INFO: Making seed reads ... 2022-03-24 22:50:44,928 - INFO: Checking seed reads and parameters ... 2022-03-24 22:50:54,253 - INFO: Making read index ... 2022-03-24 22:56:25,245 - INFO: Extending ... 2022-03-24 23:24:40,388 - INFO: Separating extended fastq file ... 2022-03-24 23:25:26,119 - INFO: Slimming output_8/extended_spades/K105/assembly_graph.fastg finished! 2022-03-24 23:25:26,119 - INFO: Extracting embplant_pt from the assemblies ... Total cost 2645.34 s |
Beta Was this translation helpful? Give feedback.
Replies: 1 comment 1 reply
-
|
There is nothing erroneous and nothing you need to do to correct it here. You may go ahead using one of PATH1 and PATH2, which are equivalent as your final assembly, The short brown contig is just a pair of directed repeats in the linear form of as,
which rolls up in the assembly graph as
Please also refer to |
Beta Was this translation helpful? Give feedback.
-
|
ok, thanks , I got it |
Beta Was this translation helpful? Give feedback.
There is nothing erroneous and nothing you need to do to correct it here. You may go ahead using one of PATH1 and PATH2, which are equivalent as your final assembly,
The short brown contig is just a pair of directed repeats in the linear form of as,
which rolls up in the assembly graph as
Please also refer to