Strange calibration plot #1378
Unanswered
MuradOmarov
asked this question in
Q&A
Strange calibration plot
#1378
Replies: 1 comment 1 reply
-
|
Hi there, I don't think you are doing anything wrong. The error is likely in the calibration part - there may just be too few cases to build a reliable calibration model. Are you able to share with me the dataset? Publically, here, or privately, at cam.davidson.pilon@gmail.com |
Beta Was this translation helpful? Give feedback.
1 reply
-
|
Thanks for your reply! |
Beta Was this translation helpful? Give feedback.
Sign up for free
to join this conversation on GitHub.
Already have an account?
Sign in to comment
Uh oh!
There was an error while loading. Please reload this page.
-
Hello!
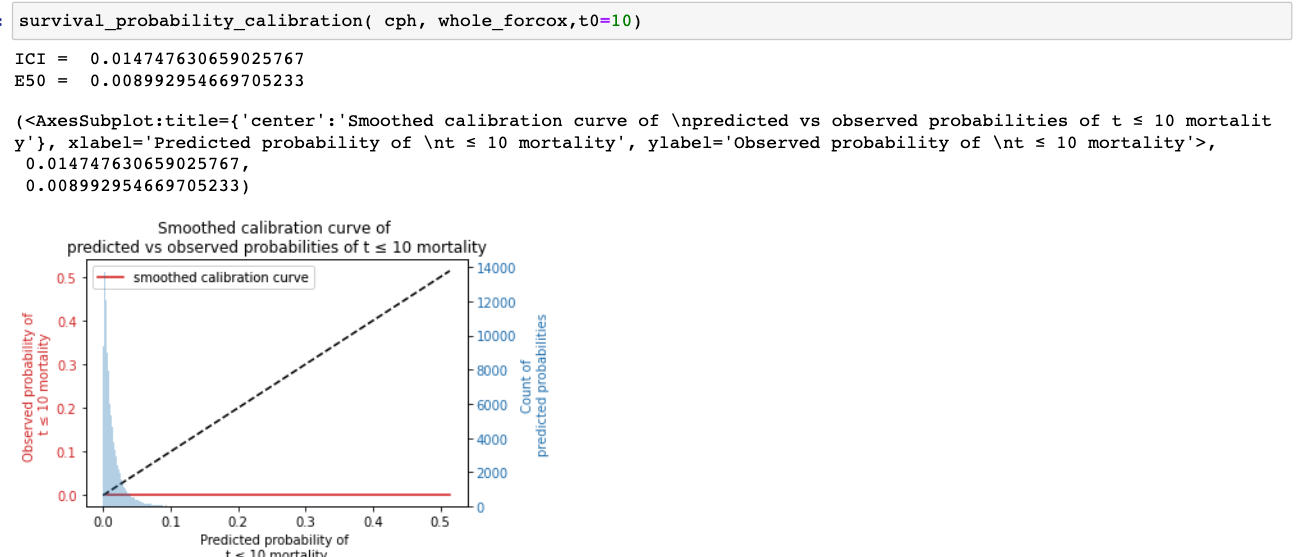
I'm trying to use lifelines in my study. I want to calibrate Cox model (with 10 predictors) with survival_probability_calibration.
There are about 2 000 cases and 130 000 controls in my dataset.
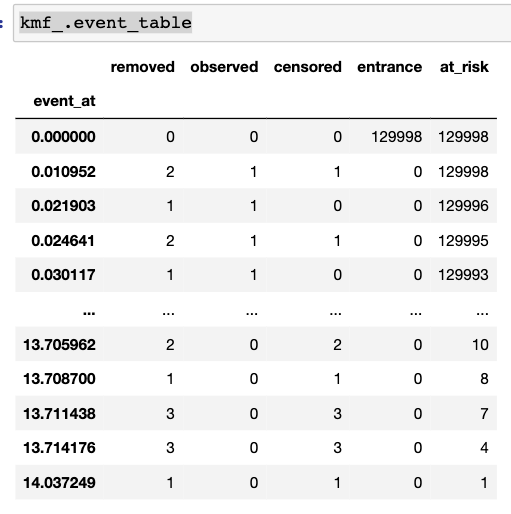
Here my event table from KM for better understanding:
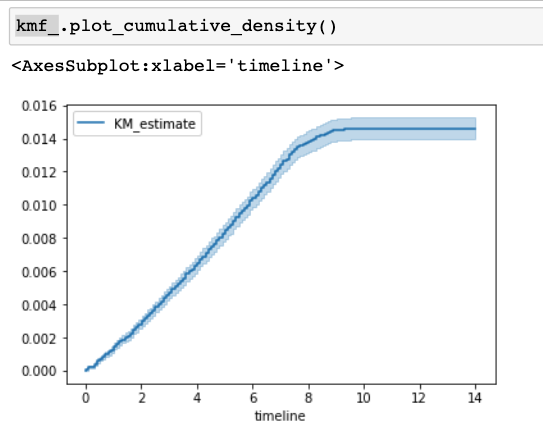
And cumulative density:
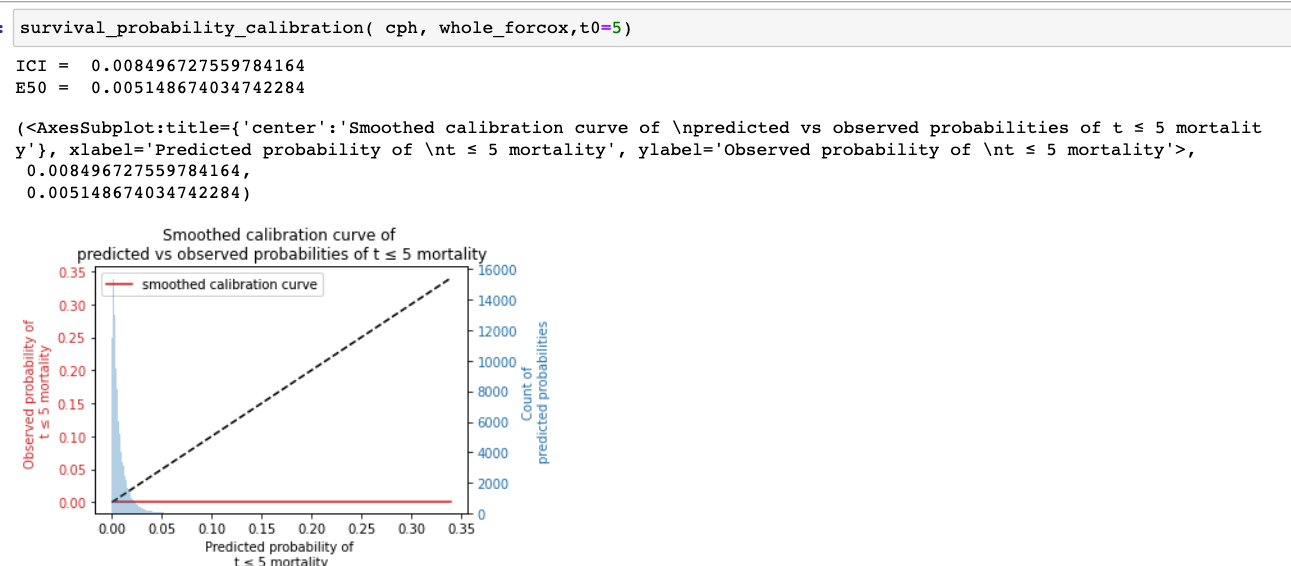
I got C-index 0,77 after fitting. But Calibration curves look very strange:
Can you tell me what I'm doing wrong?
Thanks in advance
Beta Was this translation helpful? Give feedback.
All reactions