Replies: 1 comment 2 replies
-
|
Hi @gsp97, hm interesting. Unfortunately, given how we implemented the table, it's not possible to add colors to the rows. |
Beta Was this translation helpful? Give feedback.
2 replies
Sign up for free
to join this conversation on GitHub.
Already have an account?
Sign in to comment

Uh oh!
There was an error while loading. Please reload this page.
Uh oh!
There was an error while loading. Please reload this page.
-
Hi Cameron,
Thanks for extending your helping hand and building the package . This is making a KM work get completed at ease.

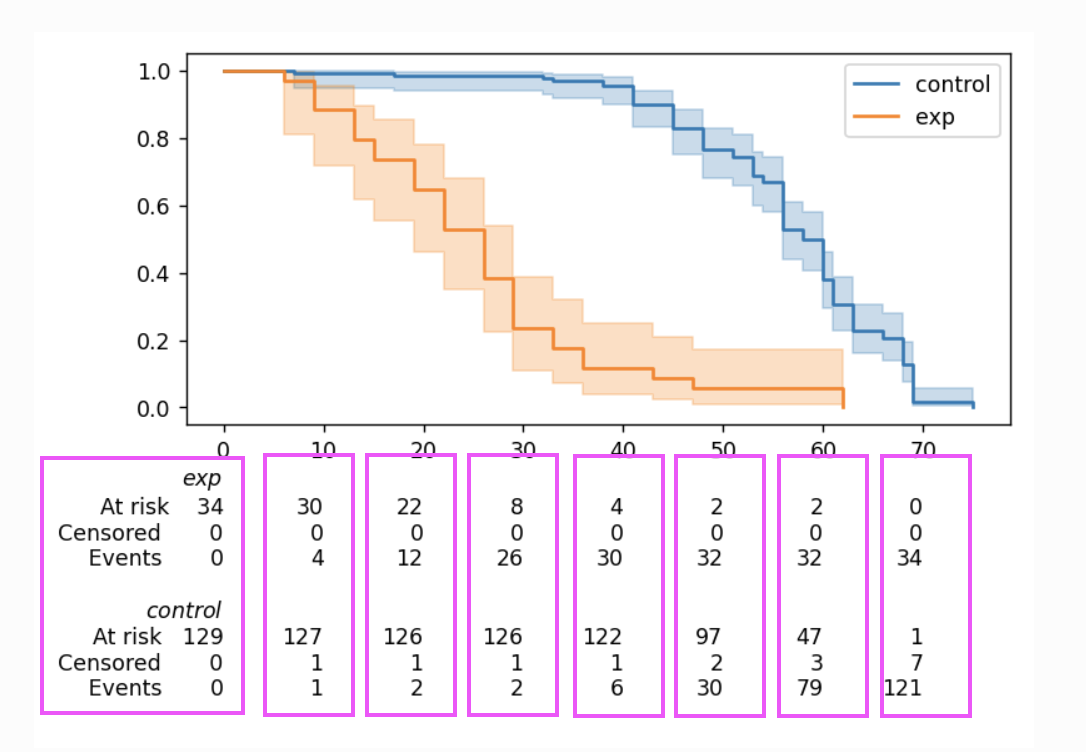
I am working on KM cumulative density and I have 6-7 groups where I need at risk counts to be represented in the same color as of the lines are being represented in the curve.
I tried using color = list of colors or color = ax which is not a right way
Please do suggest me a solution
Thanks in advance!!
Beta Was this translation helpful? Give feedback.
All reactions